The Ultimate Income Roadmap - A Mini Library of Income Generating Strategies

Special Bonus Report: How to Retire on $13,000 per Month in 5 Years or less, Tax-Free!

Click Here

The Ultimate Income Roadmap: A Mini-Library of Income Generation Strategies is brought to you by
How to Retire on $13,000 A Month, Tax-Free
100% FREE from our sponsor, Cashflow Heaven Publishing

Access the Bonus Training Here

HOW TO GET THE MOST OUT OF THIS EBOOK

Thank you for accessing the eBook- The Ultimate Income Roadmap - A Mini Library of Income Generating Strategies. This eBook is designed for beginning, intermediate and advanced traders and investors. The authors in this eBook are leading experts in evaluating opportunities in stocks, options, futures and Forex markets.

As you read this eBook and view the videos, you will be exposed to strategies and techniques that are designed to help you become more confident and consistent in your trading and investing activities. It is our sincere hope that after reading this eBook, you will take away a few actionable strategies that can help you achieve better trading consistency.

Many of the chapters in this eBook are divided into two sections:

“The Game Plan” – An introduction to a strategy and technique that may be enhanced with illustrations and examples.

“The Special Offer” – If you like the strategies and techniques being discussed, this is where you can get more information on the author and services they offer.

Some of the things you will learn in this eBook include:

At ExpireInTheMoney.com it is our sincere hope that you take away several ideas that you can use when you are done reading this eBook. You may also learn about markets that you currently don’t follow, and you will find out if they are suited to your trading and investing personality.

Finally, make sure to subscribe to ExpireInTheMoney.com.

We provide free eBooks, videos, reports and other publications for active traders. Cheers to your trading success!

Chapter
01

How to Retire on $13,000 per Month in 5 Years or Less, Tax-Free

By Peter Schultz, CashflowHeavenPublishing.com

Is it really possible to retire in five years or less on $13,000 per month, tax-free? At Cashflow Heaven, that’s exactly what we teach. What we do is teach people how to safely and effectively generate cash flow from the stock market, tax-free. Once you learn how to do that, you can literally create an income—and perhaps even financial independence—from anywhere in the world you can find an Internet connection.

It is important to realize that as appealing as that sounds, you are going to need a really good plan to make it happen. The strategy needs to be safe and it needs to work consistently. The truth is,$13,000 per month is a pretty tall order. So how do we do that?

Well, it’s an especially daunting task if you try and generate that income the way most people do it—the traditional way. If you’ve met with a professional financial advisor, you know that can be a pretty sobering experience. For example if you want to generate $13,000 per month it comes to $156,000 per year ($13,000 per month x 12 months).

Conventional Investing for Retirement Requires a Lot of Money—Maybe Too Much Money

At conventional interest rates, you are going to need a lot of money working for you to generate that level of income—maybe more than you have. For example, the interest rate on the 10-year Treasury bond is hovering around 2%--and the dividend yield on the S&P 500 is also around 2%.

So at an annual rate of return of 2% you are going to need $7,800,000 to generate $156,000 per year. That's a huge amount of money. If you've got that kind of money, congratulations. However you don't have to be good at demographics or statistics to know that most of us don't. If you're dealing with somewhat less than that, you need a good plan.

Maybe you’re a little bit better at getting returns. Maybe you're a good investor—maybe you've invested in some higher-paying dividend stocks, and you can generate 5% per year. Even at 5%, you're going to need over  $3 million  to generate $156,000. As you can see, at today's returns and today's interest rates, you need a tremendous amount of money to create a really good income.

You don’t necessarily need to get hung up on the $13,000 per month figure. Maybe you don't need that much money, maybe you need a lot less. We're just using that as an example because that's an amount most people can live on pretty comfortably (if you keep your trips to Starbucks to a minimum!).

To Retire in Style, We Need Substantially Better Returns

To reach our goal, we need to get substantially better returns than what the conventional strategies offer. Most people have mutual funds along with some dividend stocks, but are dissatisfied with their returns and want to do better.

You may be an individual who's really investigated trading and perhaps you're doing a lot of trading right now. Some people are even day trading. The problem with that is you can get mixed results. Many active traders I’ve spoken with go one step forward and two steps backward. You can have losses, and it can be pretty stressful. Sometimes the market throws some pretty frustrating curve balls.

So even if you are an active trader and enjoy it, take a look at this method because it's a way to generate some good monthly income that tends to grow faster than any other strategy out there—and you don't have to worry so much. If you're an active trader, that alone is going to be a refreshing change. In the world of investments, however, there's always uncertainty, and if you've been out there, you know that. We need as much going for us as possible, and this plan has a mathematical probability of success that is greater than 80%.

The trick with any investing is to try and get the greatest amount of return possible for the lowest amount of risk. And that's what this program is focused on—high probability and high returns. Most investment advisors tell you that’s impossible—to get high returns you must take on higher risk—but that’s not true if you have a mathematical edge.

To Make Far Better Returns SafelyGet a Nobel-Prize-Winning Formula Working for You

How do we do that? How do we engineer high returns and a high probability of winning? We're basing our expectations on a formula that is so remarkable it won the Nobel Prize back in 1997 for the mathematicians that discovered it.

The formula was actually developed back in the early 70s, and it made standardized options and the modern options market possible back in 1973. That formula is called the Black-Scholes Options Pricing Model—and here’s what it looks like:

Now, if you are thinking that looks really complicated and wondering how are you going to figure it out, well, don’t worry—you don’t have to. The metaphor I like to use is that you don't need to know all the complex workings of the internal combustion engine to drive your car to the bank—and it’s the same idea here. You just need to know enough to take advantage of it.

We’re going to use this formula to stack the odds in our favor, and to set up a mathematical expectation of winning the majority of the time. The key to using this formula to our advantage is to be selling options instead of buying them.

This gets into a really interesting area of psychology. Most options traders are buying options. The reason is they are looking for a home run—they want to double or triple their money in a very short amount of time. And the truth is, if you buy options, you will get some big winners.

But there’s a problem with that approach. If you talk to a lot of options traders, they’ll typically tell you things were going really good for a while, and then all of a sudden they blew up their account. They lost all their money.

A funny thing happens in the stock market: sometimes the things that you think are going to happen don't. You get surprises. The market turns around. It reverses. The Fed makes a certain announcement. The company that you're betting on comes out with a warning, or whatever. Whatever you thought was going to happen didn't--and that’s what makes options buyers go broke.

How to Jump on the Right Side of Options Trading

When you become an option seller you are on the opposite side of that trade, so the odds jump considerably in your favor.  A lot of surprises can happen and you can still make money. That's what I love about selling options. I've been an options trader for a long time now and I still occasionally buy an option when there's a really good setup—but the vast majority of the time I’m selling options because it’s so forgiving.

When we talk about selling options, we’re not talking about covered calls or selling naked. The strategy I’m talking about is selling credit spreads. When you sell a credit spread, you immediately take in money, and it's pretty inspiring to see that cash hit your account right off the bat.

What is a Credit Spread?

A credit spread is simply selling an option and then buying another option to hedge. The option we're selling is more valuable than the one we're buying so it creates a credit in our account. A credit, if you don't know, is money that you can use for anything you want—to buy the things you need, or to build up in your account, or to reinvest for even great profits.

So How Do We Sell a Credit Spread for Immediate Cash?

Let’s take a look. In the chart below you can see the stock going up and down, but it’s in a general uptrend. What we want to do is sell an option strike that's likely never going to get touched by the stock.

The stock is up at 107 and we’re going to sell a put option down at 99 and we're also going to buy another option as a hedge below it at 98. That limits our risk to just the distance between them, and in this case, that's just a dollar.

We're selling the 99 puts for 30 cents and buying the 98 puts for 23 cents and as you can see, there's a finish line on October 28. So in this case we’ve got about three weeks until expiration. One of the beauties of this strategy is you always know where your finish line is. At some point, in the not too distant future, these options are going to cease to exist. And if that time comes and the stock isn’t below 99—then both options expire worthless. And if you sell these spreads correctly, that’s exactly what happens the vast majority of the time.

If you ask speculative options buyers how they lost money, they’ll almost always tell you their option ran out of time before the stock could move in their direction. When that happens, the options seller is the one who makes the money. That’s who wins the majority of the time, and that’s who we want to be.

So What Can You Make on This Trade?

If we sell the 99 puts for .30 and buy the 98 puts for .23 we collect a net of .07 cents on that trade—or $700 for 100 contracts. To figure out our rate of return, we divide that .07 credit by our possible loss. The maximum that you can lose is the distance between the strikes, in this case, that's $1 but we've already taken in seven cents so the maximum we can lose is 93 cents. If we divide seven cents by 93 cents, it comes to a 7.5% return before commissions. For three weeks of time, that's 2-1/2% per week. If you get out your calculator and figure out what 2 ½% per week adds up to over time, you could become extremely rich trading this strategy.

These returns can pile up on themselves pretty quickly. It's like the old compounding illustration with the chessboard where you take a penny and put it on square one and you go to the next square and double it and go to the next square then double that, and then keep doing that for the rest of the squares on the board.

That's the way these compounding returns work—you make money on the money you just made. We get some pretty decent returns, so keep in mind, people are hoping to make 2% or 3% on their money for a year with bonds and regular dividend stocks. We're talking about making 7.5% in just three weeks!

These Returns Can Get Pretty Exciting—but It Gets Even Better…

You can also go above the stock and do the same thing with a call spread and take in another 7.5%. Now we're up to 15% for that same three weeks of time. We've got lots of room for the stock to move, but not a lot of time to do it, so you tend to win on these trades the majority of the time.

If you have a stock that's going up, you want to sell put spreads. If you have a stock that's going down, you want to sell call spreads. But oftentimes the stock is moving up and down within a range so we can sell both spreads, collect a double return, and have that stock stay within the range we’ve defined with both expiring worthless.

When we sell both call spreads and put spreads on the same stock, they are called ‘wings,’ and the whole trade is called an Iron Condor.

You can see how forgiving these trades are because we're staying away from the stock price and giving the stock room to move. The stock can go up a little bit, it can go down a little bit, it can waver all around and you still end up winning.

That Sounds Good, but How Do You Know What Your Chances of Winning Are?

You can look at the above trade and think the chances of winning are pretty good—but how do you know? Well, one of the neat things about options is that they are based on a mathematical formula. So whenever we want to sell an option, we can instantly see what the odds are that will expire worthless. That's one of the really cool advantages of this strategy—I don't know anywhere else you can do that.

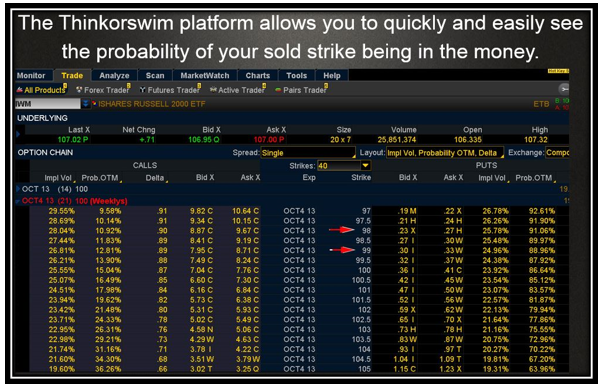
Our favorite broker for this strategy is Thinkorswim,because they have such good analytical tools, and such a great trading platform. Fortunately, with a little guidance, their platform is not hard to use—in fact, I'll show you a little bit of it right here:

This is the trading platform at thinkorswim, and if you look at the column on the far right, you’ll see a heading that says ‘Prob OTM’—that means ‘Probability of being Out of the Money’. In other words, it tells you the exact mathematical probability of this trade winning—because if the sold strike expires out of the money, the options seller wins.

One of the red arrows on the platform above points to the 98 strike price and the other points to the 99 strike price. We want to focus on the 99 strike price because that’s the one we sold. If we follow the red arrow all the way over to the far right column, we’ll see that the probability of this strike expiring out-of-the-money is 88.96%—so those are our odds of winning--which is pretty high.

It’s interesting that these probabilities actually do tend to play out over the long run, which makes your odds of winning close to nine out of 10 trades.  Which is fantastic, but even on the trades that become threatened, there are things we can do to fix them when they do go against us.

Trade with Confidence Knowing You Can Fix Trades that Aren’t Working Out

We call these little fixes “adjustments” and they give you a second chance to win if the trade doesn’t work out the first time. Everybody's always very interested in adjustments because they give you a kind of “get out of jail free card” where you can fix those one out of 10 or two out of 10 trades that aren’t working out.

Knowing how to adjust gives you a lot of confidence, which is important if you are trying to use this strategy to retire.

I know it sounds crazy, but sometimes I welcome a trade that needs to be adjusted because it says 2 things:

Number 1, we're selling close enough to the underlying to have to adjust once in a while. “Selling close” means we're bringing in more money. In other words, we're right at that edge where we're bringing in the maximum amount of dollars and still trying to minimize our risk. When you do that, when you sell a little closer to the underlying, once in a while you're going to have to adjust, but that's okay because we have some great ways of doing that.

Number 2, we have the means to adjust our way out of almost any situation. That makes you feel pretty darn confident in trading this way. Now I just want to be clear upfront, it is possible to lose trading credit spreads. The market can do crazy things, so it’s good to know that even in a worst-case scenario, the amount you can lose is absolutely limited—that’s why we buy that hedge optionto limit our risk. But in any normal market situation, even if your spread is over-run, we've got ways to adjust out of it to make the trade better.

So the vast majority of the time, you can expect to win using this strategy, but it’s important to understand there is risk in trading—but we’re going to be stacking the odds in your favor as far as we possibly can.

Sounds Good. But is Anyone Actually Doing This Successfully in the Real World?

Yes—lots of people are quietly cashflowing the markets using this strategy with great success. But nobody talks about it because everyone wants to sell you on the idea of making lottery-size profitsbuying options. But once you figure out what’s really going on, you’ll realize the real money is being made by the lottery ticket sellers.

We’ve been showing people how to sell credit spreads successfully since 2010, and we’ve got a lot of people that are real believers—they tell us with great conviction they wouldn’t trade any other way.

I want to share an email I got from one of our subscribers. I just absolutely love this guy’s attitude—his name is Bob Milota. He's the kind of guy that really gets the strategy. He’s a retired engineer so he understands numbers and probabilities—Bob is a smart guy.

After doing lots of different kinds of trading, he decided that this is all he wants to do now. This is what Bob says: "As promised, here are my trading results for the year. I very nearly had an undefeated season in my high probability credit spread trading this year. Unfortunately, I suffered my first loss for the year a week ago. My record so far for the year is, 13 put ratio spreads, all done for a credit. eight iron condors, two of which consisted of three credit spreads because I closed the winning-est side and rolled in. Plus five single credit spreads, one of which is the above-mentioned loss.

That amounts to 25 wins and one loss, which is a 96% success rate.” He goes on to say, "I made a total of $19,126 making $1,594 per month and averaging a return of 9.5% per month, including all commissions and losses."

That's pretty wonderful for Bob and those like him. I know people that are taking second jobs to make an extra $500 a month—but Bob, with a few mouse clicks, is making far more. Plus he says it’s kind of fun (and I agree). He says it keeps him sharp and it keeps him interested. He's making about $1,600 per month and that amount is constantly increasing, and we've got people that are doing a lot better than that.

So the returns are there and your probability of winning is high—but can we do even better?

Building Up Your Account Quickly and Consistently is a Big Benefit—but Can We Do It Tax Free?

There is a special account where we can trade these credit spreads so that they can build to infinity without having to pay ANY tax on the profits…Ever!

This special account is called a Roth IRA.

This kind of an IRA has some special advantages that make it perfect for trading high-probability credit spreads. Here the characteristics of a Roth:

  • Contributions are not tax deductible—however…
  • You can contribute up to $5500 per year under age 50, and $6500 over age 50.
  • Direct contributions to a Roth IRA may be withdrawn tax free at any time.
  • Earnings may be withdrawn tax free and penalty free after age 59-½.
  • Distributions from a Roth IRA do not increase your Adjusted Gross Income, so these earningsdo not increase your tax bracket on your other income.
  • The Roth IRA does not require distributions based on age. All other tax-deferred retirement plans require withdrawals by 70½.
  • Unlike distributions from a regular IRA, qualified Roth distributions do not affect the calculation of taxable social security benefits.
  • Assets in a Roth IRA can be passed on to heirs.
  • Single filers can make up to $110,000 to qualify for a full contribution and can make $110,000 to$125,000 to be eligible for a partial contribution.
  • Joint filers can make up to $173,000 to qualify for a full contribution and $173,000–$183,000 to be eligible for a partial contribution.

As you probably noted from the list above, the most compelling characteristic of a Roth is that you can build up any amount of wealth in the account you want. And as long the distributions are taken after the age of 59-½, the money you take out is Completely Tax Free.

Combine that huge advantage with a strategy that consistently makes money, and you’ve got a blueprint to create a comfortable retirement no matter where you are starting from now.

So Your Odds of Winning are Excellent—And Now You Have a Way to Build Up Those Profits Tax Free—But How Much Can We Expect to Make?

We typically shoot for 15% to 25% returns for just two weeks of time. But it’s important to realize you want to hold back about a third of your account in cash for buy-backs and adjustments, so you’re not getting those returns on the whole account. Plus, in spite of our best efforts there will belosing trades—that’s how trading works, so we have to factor those in.

Trading this strategy with our probability of winning typically returns about 10% every two weeks. Now if you are a speculative trader, that might not sound like much—but it is when you consider your win ratio. If you are consistently making that kind of money every two weeks, you are going to be very wealthy within just a few years.

But let’s say you’re a little skeptical about those returns. Let’s say that in the real world something always happens, and our theoretical rate of return doesn’t quite materialize.

Let’s say that all you can generate is just 5% per month—not 10% every two weeks, but just 5% per month—that’s about a quarter of what we can mathematically expect even factoring in losses and holding a portion of the account in cash.

If the maximum we can put into a Roth is $6,500 per year—and we faithfully put that in every year—what does your account turn into at “just” 5% per month? Here’s what your account looks like if you invest $6,500 per year and get 5% per month over a five-year period:

As you can see from the chart above, by year two you are making approximately what Bob is making now—but by year five you are making an inspiring $12,965 per month—and the very next month that grows to $13,613 and the income grows even more steeply after that.

And your account itself has grown to over a quarter of a million dollars! At that point, you can start living off some of your profits and still see your account grow. And the inspiring thing is all it took was an investment of $6,500 per year—an amount most people can save or already have.

Which means you aren’t more than five years away from a comfortable retirement—all you need is a little know-how to make it work.

I’ve put together a complete presentation on how to trade this strategy. You’ll see our favorite way to adjust a spread if it is moving against you so you’ll never have to worry about stock reversals. I will also show you more actual examples of how to set up your trades so you really get the concept.

Plus, I’ll introduce you to others that are trading this way, including my cousin Ralph out in Chicago, and a lady that is managing a fund by selling options that is literally making millions of dollars per year. So you can see this concept works no matter how big your account gets.

And I’ll show you the proof—you’ll get a link to interviews with her where you can see for yourself what she doing. And I guarantee that you’ll come away inspired.

I believe so strongly that this strategy can make a beneficial change in your financial outlook that I want you to access this special presentation for free. It’s only about 60 minutes, but it could change your life.

Once you register, I’ll send you our Tuesday night updates so you can see for yourself how these trades work in the real world.

THE SPECIAL OFFER

So once again—click this link to watch—and I’ll look forward to showing you a little-known but amazingly effective way to create a level of cashflow that makes it more possible than ever to retire on your own terms.

Keep up the good work, and I’ll look forward to seeing you inside the presentation,

Peter

ABOUT THE AUTHOR

Author: Peter Schultz, Founder
Company: Cashflow Heaven Publishing
Website: CashflowHeavenPublishing.com
Services Offered: Trading Courses, Coaching, Weekly Advisory Newsletter
Markets Covered: Stocks, Options

Peter has been showing self-directed investors how to trade successfully since 1996, and is a nationally known speaker on options trading, the author of Passage to Freedom, The Options Success Trading Package, The Winning Secret Trading Package, The Explosive Profits Package and The Greatest Options Strategies on Earth.

Chapter
02

A Trading Guide For Building Wealth & Income

By Larry Gaines, PowerCycleTrading.com

My name is Larry Gaines, and my trading career started in 1980 in Houston, Texas as foreign crude oil cargo trader. In 1990 I became the Executive Vice President for one of the largest oil trading companies in the world and ran their international trading desk for over 10 years. Today I run my own company, powercycletrading.com, were I offer comprehensive trading courses, coaching and trading services.

My friends at Sir Isaac Publishing asked me to give a presentation on How to Build Wealth and Income trading your "Nest Egg" and what important topic. I started out my trading career trading big accounts, of other people’s money (OPM), but when I went out on my own and started trading for myself and it was my own money the whole game really changed. It was now my Nest Egg at risk.

Now trading for yourself can be one of the most rewarding jobs on the planet, if you are educated about what you are trading and if you stay focused on managing your trading risk.

I tell my clients and members “there’s no perfect trader…there’s no perfect system… it’s a journey of learning and I am on that journey too…constantly learning each and every day…”

And in my opinion the most important lesson in trading is that you should not be just focused on making money but should really be focused on managing your trading attitude and risk and then the profits will come…

My real AHA trading moment came when I reset my trading mindset and started to incorporate a variety of well defined, low risk Option Strategies into my trading. To be a successful trader mindset, risk management and consistency is what wins outand this is what I’ll cover in this presentation.

Here are some important actions you can take that will get you started on your trading journey for building wealth and income.

Actions & Attitudes of Successful Traders:

Mistakes sabotage every area of our lives, and trading is no exception. The good news is that we learn from our mistakes. In fact, seeing mistakes as learning opportunities is the popular approach to viewing human error and with good reason since they provide learning lessons aplenty, albeit often excruciatingly painful ones both in the psyche and the bank account. In over 3 decades of trading, I have probably seen every trading mistake possible, and I’ve even made most of them.

As in life, mistakes seem to recur until we own them and modify, at which time we overcome that particular error and move on to the next. The good news is that you can learn by observing and studying the behaviors and habits of successful traders who have already been in the trenches and learned from their mistakes. This practice can shave years off of a trader’s learning curve. It’s all about adopting the powerful actions and attitudes of successful traders. 

There is no perfect trader or perfect system but in order to become a consistently good trader you must constantly be observing not only the markets, but also other experienced traders to gain knowledge and wisdom. It’s a never ending journey, like most valuable pursuits, but it can be an extremely rewarding one, both personally and financially. 

When you model top trader’s actions, you make more money. It’s that simple. They’ve figured it out from years of experience, and you learn from them how to make more money in much less time.

Consistently getting in or out of trades too soon…or too late

The culprit behind this common error is trading from fear or greed instead of following a chosen strategy. In trading it’s not always about trading the right option, the best model, or the perfect entry; it’s way bigger than that. If your attitude is not right, and your trading related actions aren't right, then even the best technicals can't help generate profitable trading results for the big or small trader it’s all the same.

Studies show that 60% to 80% of trading success comes from a trader’s mental and emotional state. Great traders are always working to keep their emotions out of their trading. By developing a state of detachment when trading, you can neutralize those emotions that can otherwise control your trading actions.

Being a lone ranger

Everyone knows that the nature of trading is to go it alone. Trading attracts the introverted analytical thinker who generally thrives on hours of uninterrupted time to completely focus on the next great trade or indicator. The focus time can be beneficial, but the lack of accountability and team camaraderie is not. Being someone who has spent decades in the enthusiasm of a live trading room, complete with both shared cursing and celebrations, I can say that camaraderie is real, and it’s an asset. The value of camaraderie explains the proliferation of virtual trading rooms over the past few years, and my drive to have created one of the first. 

No plan for success or goals

Have you ever noticed how easy it is to jump into a trade that is outside of your trading plan? A plan encourages self-discipline and accountability. A good plan includes the following features.

  • Capital allocated to trading
  • Defined risk reward 
  • Time frame for holding trades
  • Working hours
  • Parameters around paper vs. real trading
  • Structured time for accounting and review
  • Tested model or system

Start with a plan and stick to it. Review it often and adapt it as you learn and improve.

Trading a model that doesn't work

Time and expense are usually the perpetrator with this costly saboteur. The perfect analogy is buying something that doesn’t work when you’ve gone shopping just so you haven’t wasted your time. The trader thinks about how long it took to learn the system, or the investment, often in the thousands, that was made to purchase the model. The solution is to buy a proven system from a demonstrated expert, and get the support to correctly learn and implement the model swiftly.   

Not thoroughly reviewing trades and accompanying charts

Let’s face it; it’s much more enticing to trade than to review trades, but the reality is that successful trading comes from reviewing what you did that worked, and doing more of it. It’s that simple. Without consistent time dedicated for review, this can’t be done.

Take time to review each trade; this is your money, and your business. Write the answers to the following questions in a log:

What worked?

What didn’t work?

What were the indicators doing?

What time of day was the trade made?

Why was the trade placed?

Why was the trade exited?

Could a slight tweak have made the trade more profitable?

Not accounting for trades

Have you ever known a trader that likes to do accounting? Traders love the excitement of the trade, but hate the boredom of all the surrounding responsibilities, such as accounting, taxation and documentation. Boredom, avoidance of responsibility and denial are the backing behind this common slipup. It’s a lot easier to think about that great winning trade you made than to look at hard after commission numbers. Numbers don’t lie, but they are a strong teacher for how to improve results because they allow you to see what’s working and do more of it. 

The solution is to schedule time for accounting. It’s so easy now with downloads from most brokers. With zero costs, you’ll then have the numbers to reveal the most potent answers you can get to improve your trading results.

Lack of goal setting

As Peter Drucker said “What gets measured gets done”. This paradigm is a step above accounting and review. Goal setting is about taking the big picture view of your overall life and money. Take this a step further and think about what your life will be like upon achieving those results.

Define what you want to make from your trading business. Review it often. As Drucker said, measure your results, and then compare them to your goals. This motivating habit drives you to do the mundane, like to accounting. It drives you to show up to trade when you want to play golf instead on that perfectly beautiful day.

Trading with the emotions of fear and greed

Trading emotions could be an entire book, and it often is; your beliefs about money go all the way back to your childhood. What was happening in your childhood home around money? Was there never enough? Were you taught to manage money? Was there predominantly fear or greed? As woo woo as this sounds, taking a few minutes to think about this unseen force can quickly and easily help you spot those same patterns in your trading.

The way successful traders overcome this powerful saboteur is by trading from a plan, which allows complete detachment. A simple exercise to discern whether emotions affect your trading is to paper trade for a few days. Notice if the results are different from real trading. Of course, live trading can provide slightly different results due to the actual fill; take this into consideration, account for it and try to see how differently your trading results are when real money is not changing hands vs. when it is. This easy little application can reveal powerful insights about how your emotions may be hurting your profits.

Another clue is to notice how you feel when you trade. Does your heart race when you place a trade? Are you unable to leave your charts beyond the time designated in your trading plan? These are signs of emotional trading. Some of the best traders in my virtual trading room have consistently exited the room promptly at 9:30 daily. They are done, based on their trading plan. It’s unemotional and detached.

Fear causes traders to miss out on winning trades, or close trades before the optimum exit. Greed causes traders to stay in trades beyond their planned exit, or to take trades outside of their plan. Emotions exhaust traders.

First, recognize your money patterns and own them. Choose to not allow someone else’s past issues affect your trading results. Again, the crucial key is to detach emotionally from your trading. The best way to detach is to trade from a well thought out plan.

As you read this article, which points made you squirm the most? The most uncomfortable points will be the first area to focus on to improve your trading results. Discomfort signals denial or expansion. The great thing is that most of the points above are absolutely free. That’s a risk reward you don’t see often in the trading world. I’ll take it.      

An Option Strategy Guide to get you started:

General Option Guidelines:

  • When Implied volatility is high it is better to sell options (Credit Spreads, Iron Condors)
  • When Implied Volatility is low it’s better to buy options (Delta 50 to 70)& Vertical Option Debit Spreads
  • When a market is in a consolidation phase or a volatility compression squeeze, look at this as a sign that a low volatility environment is about to change into a high volatility environment.
  • And change your trading style accordingly.

Go-to-Option Strategies ~ for defined, low risk trading:

  • Long Calls or Puts ~ can be used for all day trading, swing trade set-ups and long term trend trades. Best when implied volatility is low, generally use a 60-70 delta for strike. A defined risk with unlimited profit upside 
  • Vertical Debit Spreads~ can be used for all Swing Trade Set-ups & long term trend trades. Best when implied volatility is low. Defined risk, low capital cost, low time decay but profit upside is capped 
  • Long Butterfly ~ this spread is a neutral strategy that is a combination of a bull call debit spread and a bear call credit spread. It is a limited profit, limited risk options strategy. There are 3 striking prices involved in a butterfly spread and it can be constructed using calls or puts. Used when you think the underlying stock will not rise or fall much by expiration. Trade results in a net debit. Short volatility & price pinning strategy.
  • Credit Spreads ~ can be used for day trades, swing trade set-ups & long term trades. Best used when implied volatility is high. A defined risk, takes advantage of time decay & a sideways price action but profit upside is capped. Three variations; OTM (negative risk ratio), ATM (neutral risk ratio) & ITM (positive risk ratio). Short volatility & time decay strategy.

CONCLUSION

Once you have the right trading mindset and learn to use some well-defined, low risk Option Strategies your journey to successful trading will become a short one and well worth the time and effort you put in.

THE SPECIAL OFFER

Larry’s option course, “Selling Options for Income Profits & Opportunistic Hedging” is a complete step-by-step program on how to trade the option credit spreads for consistent monthly income. Credit spreads are sort of like having insurance on your home, but this insurance actually pays you…and pays you very well (unlike the miniscule returns from common annuity contracts touted as income tools).

This comprehensive option credit spread course is over 5 hours of training that you can watch at your own pace as often as you want and comes with a 389 page power point training manual of course. Plus, properly structured credit spreads can grow your account from small to large…Click below to order now for $97!

ABOUT THE AUTHOR

Author: Larry Gaines, Founder
Company: Power Cycle Trading
Website: PowerCycleTrading.com
Services Offered: Trading Courses, Bootcamps/Coaching, Custom Indicators
Markets Covered: Stocks, Options, Futures

Larry Gaines has been involved in trading and brokering commodities and financial markets for over thirty years. Today, Larry trades options and futures, where he enjoys teaching others to generate income from trading using a disciplined systematic based on decades of trading experience.

Chapter
03

How I Went from Total Trading Chump a to Semi-Respectable, Yet Still-A-Little-Bit-Crazy Trading Guy

By Rob Booker, RobBooker.com

I like trading stocks, and I hope you do, too. I started my trading career in 2001, with $2,500 and a dream. Then I crushed my own dream by losing all of my money. I blew up my trading account in a stupid trade.

Why? Because I lost focus, like an animal chasing after a shiny object. I vowed never to do that again.

This little book is about finding great stocks before they move big. I call them “Easy Stocks” because they’re easy to say yes to. They’re easy to spot, after you know what you’re looking for.

This is my way of protecting my portfolio - I look for good stocks that are undervalued, then I buy them. Even if there is a stock-market shock, at least I’m holding companies with good fundamentals.

All right, then. If you’re ready ...

We’re going to have a good time in the next few pages, because if you’re interested in reducing your losses and maximizing your returns, you’re in the right place.

So grab a cup of your favorite drink, maybe a hot cup of tea, and settle in. You can get comfortable and spend the next few minutes with me - because we’re going to do this the easy way.

I call this “Easy Stocks” for a reason. So, if you’re looking for complicated stuff … I’m not your guy. But if you’re into simplicity, and stuff that works, and saving time, and having the chance to make more money ...then let’s light this candle.

Most Investors Hate Value Stocks - and That’s Our Big Opportunity

A value stock is a stock with good fundamentals, a good price/earnings ratio - stuff like that - that is priced well below its peers. That’s an oversimplification, but I passionately hate complexity. I see no point in wasting time. These stocks have fallen out of favor for two reasons:

  1. Some of these stocks are garbage. They’re “on sale” for a reason.

  2. Everyone wants to buy bitcoin, and the FANG stocks. We’re in a bubble.

But my value stocks are killing it. I mean, killing it. I’ve built a way to scan for high-quality stocks with good fundamentals, and then buy them on sale. It’s the fastest way I know to find the biggest movers, in the shortest amount of time. And because most investors avoid these value stocks right now - because they’ve fallen in love with the newest fad - you and I have an opportunity. Because you’ll be paying attention, you’ll be able to find the big moves before they happen.

The Easy Stocks Scan: How to Find Value Stocks that Aren’t Complete Garbage

We’re going to do a scan (I’ve already done it for you, and I’ll share a link with you in just a moment).

But first, I want to teach you “how to fish,” so to speak. I’ll show you how to do it, and then if you want me to do it for you, I can do that, too.

Step One

  1. Go to http://finviz.com

  2. Or, if you want to skip to the good stuff, and you want me to do the scan for you, just go to https://easystocks.net and I’ve got the scan already done for you. (No need to worry, it’s free). 

Step Two

  1. Run a scan for stocks with these parameters:

  2. Return on Equity - above 20%

  3. Return on Investment - positive (anything positive is good)

  4. Return on Assets - positive (once again, anything positive is good)

  5. Average volume - above 1 million shares

  6. Current ratio - above 3

This is what it will look like when you’re done:

In this scan, we found 30 stocks. That’s normal. When you do this, you’ll find 20-50 stocks worth buying. 

Everything else is garbage. That’s the way I see it.

This is how I look at it, so I don’t get sucked into a stupid trade, or a “new shiny object.” This is how I focus. And focus is money. I’m sure there are lots of other “good” stocks out there. No denying it. But I need to focus. Remember that: focus is money.

Now that we have a watchlist of value stocks, we’ve opened the door of opportunity. Some of these stocks will be famous names. That’s ok. But most of them won’t be on anyone’s watch lists. The windbag financial TV hosts will never feature these stocks.

Great. We don’t want to trade stocks that a TV host recommends. Those people are paid to have ideas, not to have good trades. Good for them. I’m sure some of them are ok people. I’m also sure that most of them should be thrown off the air for just spewing out trade ideas that they don’t even take. Sorry. I get a bit hot about all this.

If you’re interested in getting more details on the “why” behind these stocks, and a complete list of the latest names on my scan, go to https://easystocks.net and grab the scan. I’ll also send you a detailed explanation of why the scan finds the best value stocks.

Now, let’s talk about getting into the trade.

The Trade: When & How to Get into Easy Stocks

Imagine this:

You’ve had your eye on a little storage business down the road. It’s probably worth a million dollars. But you don’t have a million dollars. You’d sure like to own that storage business, because it keeps churning out money, month after month. People have a lot of junk and they need someplace to put it. So they take it down to the storage place, put it in a garage, and never look at it again. Oh, and they’re paying $50 a month to do that. Month after month.

The business has great fundamentals. It’s never going to do anything fancy. It’s just going to make money, like a little cash machine. Oh, and one more thing: It always pays its bills on time, and has no debt.

Now - what if …

That business has one bad quarter. Say, there’s a big storm in your area, and there was a lot of flooding. The storage facility was fine. But the owner got freaked out, and now … he wants to get out. He wants to sell the business.

In fact, he’s met the love of his life on Tinder. They both “swiped right,” or whatever people do on that website. Now he wants to get out of town, sell the business, and move to Topeka, where he can make 1,000 babies with his new love, and he will never have to worry about big storms.

So …

He suddenly gets freaked out, and he wants OUT of his business. He puts it up for sale. As they say, “time is of the essence.” You walk down the road, pop into the office, and you offer him $800,000. You know the business is worth at least a million bucks. And he says yes. Right on the spot. You got a deal. You got a great business at a fair price. Nice work!

Here’s the great news: This is exactly how we do it with value stocks.

We wait for the owners of a good company (the shareholders) to freak out. When they freak out, they jump out of the stock. And we jump in. Here’s how I do it.

Step One: Earnings

Here’s a photo of what happens to ordinary investors at earnings:


At earnings, people go a little bit crazy. Here are just a few things that can happen after earnings:

  1. A good stock can fall fast because of an earnings miss.

  2. A good stock can fall fast because of a statement made on the earnings call.

  3. A good stock can fall fast because of a statement in the 10Q filing. I read these for fun, because I am a nerdface.

When any of those 3 things happen, we have an opportunity.

It’s okay if a good company misses on their earnings. It’s ok if they have a temporary setback. If they are a good company, and have little or no debt (this is key) then we can bet that over time, they’ll make money, and if they make money, investors will want to own a piece of the company.

In other words, we like it when good companies have short-term problems.

We want to own those stocks, but we don’t want to pay full price.

STEP TWO: PRICE DROP OF 7-10% (or more)

Next, we want to wait for the stock to go on sale.

There are two ways this can happen:

  1. Price drops almost immediately - 24-72 hours after earnings. I’ll show you what this looks like in a moment. This is my favorite kind of trading opportunity, because it shows that investors have panicked. We like to take advantage of that. Panic moves down can lead to euphoric moves higher. That’s exactly what we like.

  2. Price drops during the 2-3 weeks after earnings. This is also common, and it’s ok but not great. If price is falling steadily, that means that people are thinking about it, thinking through it. Maybe there’s a good reason the stock is falling. So I’ll be more cautious in these instances. I’ll probably still take the trade. But I’ll reduce the size of the trade.

I thought you might like to see some examples of what all of this looks like.

So here are some charts:


Figure 3: OCLR After Earnings

In Figure 3 above, traders go into “panic sell mode” after OCLR reports earnings. The stock drops 10%. What do we do? We step in and we buy. 

I know you’ll have questions about indicators, trade size, stop-losses, and more - and we’ll get to all of that in a moment.

But here’s another example:

Figure 4: GTN after earnings

In Figure 4, the sell-off takes longer. Two weeks after GTN reports earnings, the stock slips lower, finally reaching a 10% drop. That’s when we buy.

Now, let’s look at a third example, and then I want to answer all your questions about the charts and trade sizing and position management, so you’re feeling like you know what you’re doing here.

Figure 5: CORT after earnings

In our final example, we’ve got some crazy shiz going down. One day after earnings, price shoots WAY up. Then, within just 60 minutes, it drops 10%. Or more. That’s when we buy.

Got it? We’re waiting for earnings. We’re only trading after earnings. We’re only looking at companies with good fundamentals. We’re only trading when a stock we like goes on sale. Now let’s talk about managing the trade.

Managing The Trade: You’re in the Trade - Now What?

The first rule of Easy Stocks: Trade Small and Don’t lose money. Well. At least - don’t lose a lot of money. If we get into a trade, and the price drops another 2-3% then we’re OUT. We drop it. We’re done. Cut the losers.

Of course, if we want to do a long-term buy and hold strategy - sure, that’s fine. These are value stocks. Trade small, hold on, build a portfolio. That’s fine with me. Of course, you’ll pay less taxes on your gains when you hold for 12 months. So, please, by all means, be my guest - I do this as well.

Guidelines for Short-Term Trade Management

  1. Size of Trade: Allocate a small portion of the portfolio for the trade - maybe set aside 2% of total available trading capital to buy a value stock.

  2. Stop-Loss: Stop out if the price drops another 2-3% (maximum 5%). When in doubt, get out. We can always get back in. Short-term traders get into massive trouble when they try to turn a short-term trade into a long-term position.

  3. Profit Target: When the stock gains 5-10%, we take our gains.

  4. Time-Based Stop: We have a maximum holding period on short-term trades of 30 days. If the stock hasn’t hit our stop, or our profit target, during that time - we simply get out.

Guidelines for Long-Term Trade Management

  1. Size of Position for Longer-Term Traders: If the plan is to buy and hold longer term, allocate a maximum of 4% - and enter a half-sized position to start. This means we’ll have capital left over to add to the trade.

  2. If the Stock Drops, Add to the Trade: If it goes on sale again - another 10% - then we can add a bit more to the trade. We never allocate more than 4% of our total trading capital.

  3. Stop-Loss: We’re holding these trades for the long-term. We don’t jump out of these trades on a whim. We’re expecting that over the longer-term, our portfolio of value stocks will appreciate. Generally, I will buy these stocks with a small amount of capital (maybe allocate 1% of my portfolio) and then forget about them. Just check on them once a quarter.

  4. Profit Target: Once again, with longer-term trades, we’re less concerned about getting out. We want to hold these for 12 months or more. But if after 12 months, the stock has jumped 20% or more, we’re happy to close the position and move on to another idea. Or hold on for the long-long-long term, and not worry about taking profit at all.

THE SPECIAL OFFER

Done-For-You Scan, Indicators, and More

I hope you’ve enjoyed this article. I’ve had a great time writing it.

As a way of saying thank you for finishing this book - you’re clearly a Person Who Takes Action-  I’ve got some gifts for you:

Done-For-You-Scan

Would you like me to scan for these stocks, for you? Go here, and you can get the scan for free:

You’ll get a link to my spreadsheet where I’ve got my primary value stock watchlist.

You probably noticed that I’ve got some extra indicators on my charts. These help me time my trade entries and more. As I’m typing these words, my programmer is finishing up the indicator package for TradeStation, Esignal, TOS, Sierra Charts, NinjaTrader, and more. If you jump over to the website, and download the scan, I’ll send you an email when the indicator package is ready:

And - if you’d ever like to say hello, I’d love to hear from you. You can text me anytime at 1-304-281-8332 - and let say hello, let me know you read the ebook, and tell me where you’re from.

ABOUT THE AUTHOR

Author: Rob Booker, Founder
Company: RobBooker.com
Website: RobBooker.com
Services Offered: Trade Alerts, Robots, Trading Indicators, Podcast, Trading Rooms
Markets Covered: Forex, Futures, Stocks

Rob currently hosts of The Trader’s Podcast (available on iTunes) and is the author of the book “Adventures of a Currency Trader: A Fable about Trading, Courage, and Doing the Right Thing.“

Chapter
04

HOW TO GENERATE TRIPLE DIGIT GAINS WITH GROWTH AND TECH STOCKS!

By Todd Mitchell, TradingConcepts.com

In this report, I’m going to outline the three of the biggest factors that sabotage the majority of stocks, options and ETF traders and show you the steps that you can take to avoid falling into this trap!

One of the most interesting things that I’ve learned over the past 30 years of professional trading has very little do with the mechanics of trading stocks, options or ETFs and more to do with the human mind and more importantly human behavior.

There’s something about human nature that’s truly remarkable and at the same time absolutely fascinating.

When it comes to making consistent profits from the financial markets, most people are by far and away their worst enemy!

Essentially, I find that the great majority of retail traders get in their own way and make things much more complicated than they have to be…and ultimately sabotage themselves and ruin the possibility of achieving consistent profitability over time.

Retail Traders Utilize Trading Tools That Were Created before the First Man Landed on the Moon and Expect Them to Compete with Multi-billion dollar Hedge Funds!

The first big mistakes that traders making consistently is utilizing indicators that were specifically designed and created to work with the commodity market and assume that they will work with stocks, options and ETFs.

The problem with this theory is the fact that commodities, currencies and futures are predominantly trending markets, while stocks are predominantly counter trend markets and indicators that work well with trending markets are not nearly as effective with counter trend markets.

Furthermore, the great majority of technical indicators are lagging indicators that reflect what already happened or occurred in the past.

What does that mean? It means that you are relying on something that happened in the past to help you gauge future price movement…that’s equivalent to driving your car while looking at the rear-view mirror and that will cause you to crash!

Take the moving average indicator which is probably the most popular technical indicator of all time. The indicator was designed in the late sixties to help gauge trends in commodity markets.

During this period of time commodities trended very strongly and the moving average was especially effective because of the massive trends in commodities during that period of time.

But the moving average indicator was never intended, designed or tested with stocks or any type of equities markets in mind and neither were dozens of technical indicators that come preloaded with your online stock broker software.

If you think about it logically, you will realize that the great majority of technical indicators were created over 40 years ago, when the stock market showed very little volatility or directional movement…as a matter of fact the average daily range for most stocks at that time was less than $.25 and any form of speculative trading was strictly limited to the commodities, currencies and futures markets.

But over 40 years later, millions of traders use the exact same indicators to gauge price movement in equities without any degree of success!

Fortunately, there’s a very simple way to gauge stocks, options and ETFs that works amazingly well and doesn’t rely on indictors that were created, designed and tested for different types of financial markets over 40 years ago.

Relative Strength or Comparative Strength Analysis Tells You Exactly What Stocks Are Being Purchased Aggressively By the Largest and Most Aggressive Funds in the World!

Over the past 20 years, large hedge funds have come to dominate the stock market. If you think about it logically, you will realize that it takes massive amount of volume to move large cap stocks like Google, Tesla and Amazon…and only the biggest mutual funds have the buying power to accumulate millions of shares continuously over several days or weeks at a time.

Institutional money continuously rotates money into the strongest stocks and money out of weaker stocks.

The stronger one stock becomes the more money flows into that stock and out of weaker ones...that’s how the biggest growth stocks on the planet move higher ad gain momentum continuously over several weeks or months and that’s how the biggest stocks in the world double and triple in price and remain resilient to short term stock market corrections.

Comparative or relative price analysis is the process of comparing the percentage increase in value of one stock to another stock during the same time period.

The example below is a simple demonstration of comparing 4 different stocks over a 2 month time period. The odds are strong that stock D will continue to outperform all other stocks because at the present time the biggest funds in the world are accumulating this stock aggressively and the odds are relatively high that they will continue to purchase this particular stock if the relative strength continues at this rate.

This type of analysis is much more powerful and effective than relying on indicators that are derived from price action that already happened in the past…something that has no forecasting value for stocks in the first place.

If you want to see which horse is the fastest you compare it against all other horses in the race and that’s the approach that Multi-Billion dollar hedge funds utilize to buy stocks and sell stocks.

I typically analyze relative strength on a 2 month, 4 month and 6 month time frame and target stocks that are part of the NASDAQ 100, the biggest tech and growth stocks in the world.

These stocks have strong institutional sponsorship, liquidity and most importantly the potential for massive price appreciation… and that makes them ideal candidates for relative strength or comparative strength analysis.

And most importantly, this is how multibillion dollar hedge funds decide which stocks to buy and which ones to sell and something you should consider incorporating into your trading.

Comparing Current Volatility to Past Volatility Is One of the Best Ways to Determine If Stocks Will Continue Trending or Will Become Choppy!

I’m going to let you in on a little secret...something that most institutional traders have known for years, volatility or average daily price movement when compared to past price movement can give us a very strong indication of future price movement.

While this may sound a bit confusing, it’s actually very simple…let me show you by way of example.

Take a look at the Amazon chart below. Notice that during the entire period of time the level of daily volatility is fairly consistent…in other words the day to day price fluctuations are fairly even across the entire time period.

This tells me that the odds of seeing further price appreciation is fairly probable, since volatility levels have not increases substantially.

If volatility increases or spikes, it usually means there’s a shift or a change of balance between buyers and sellers and the stock or ETF will begin either stagnating or moving sideways and possibly even turn around and begin trading lower.

The QQQ ETF example that you see below is a good example of a major spike in volatility, with the trading range being roughly 3 to 4 times the average daily range over the past 2 months.

When I see such strong spikes in volatility, especially after a significant trending period, it tells me that the stock or ETF is getting ready to stagnate and become range bound or alternatively begin trading lower instead.

I can tell you from over 2 decades of professional trading, running a hedge fund and back testing just about every methodology under the sun…change in volatility is one of the most significant factors that determines whether or not the trend will come to an end and it’s something that most retail traders completely ignore.

Adding This One Single Asset to Your Portfolio Can Aggressively Increase Profits and Reduce The Number of Losing Trades!

Take a look at the two charts below…notice how one goes straight down while the other one goes straight up.

To give you a better understanding…the chart on the left is the chart of the stock market during the worst part of 2008, while the chart on the right is the chart of the long bond during the exact same period of time.

As you can clearly see from the example above…when the stock market trades lower, the bond market trades higher. This is called flight to quality and when stocks trade lower, investors shift or rotate out of stocks and into safer class of investments, which is fixed income or the bond market.

If you look at any major stock market correction, you will see that bonds trade higher when stocks trade lower, it’s that simple.

Why is this important? Because trading the long bond is how just about every large multibillion dollar hedge fund offsets risk instead of relying on stop loss orders. This can cause your position to be stopped out prematurely, before the big move occurs!

And if there’s anything worse than being stopped out of a stock…it’s getting stopped out before the stock begins to trade higher, which will not only cause you to take a loss, but it would also cause you to miss out on the profit potential too!

In the past, before ETFs were created, traders had to go to the futures market and trade the 30 year long bond or the 10 year Treasury note. Unfortunately, this required understanding of the futures markets and required a hefty margin, since each futures contracts face value is equal to $100,000.

At the present time, traders don’t have to worry about learning how to trade futures, understanding contract expirations or having to trade large sized account to enjoy the benefits that come with holding a portion of your portfolio in the long bond.

Over the past 10 years however, hundreds of different ETFs were created, which trade in shares just like any stock, but at the same time track the performance of numerous commodities and/or currencies.

In short, there are several assets, such as the TLT or the EDV or even the leveraged TMF, which track the performance of the long bond almost tick for tick. This gives the retail trader the advantage of having the long bond in their portfolio, without the downside of having to trade large futures contracts instead.

I wanted you to see for yourself…the degree of correlation between the actual futures contract and the ETF.

On the left side is the long bond ETF which shows trades exactly like a stock, there’s no contract roll overs and you can buy as little as 1 share or 50,000 shares, which means you can utilize it effectively in either a small account or a large account.

The chart to the right is the actual 30 year long bond futures contract during the same exact time period. The 30 year is a fixed sized contract that professional hedge fund managers utilized for decades to offset risk while holding stocks instead of relying on stop loss orders.

Let’s Put Together Everything I Covered!

To summarize, the great majority of technical indicators were never created, designed or tested with stocks in mind.

Most indicators are lagging indicators that reflect what already happened in the past and do not work effectively with counter trend markets such as the stock market.

Applying lagging indicators to the stock market is equivalent to driving your car while looking at the rear-view mirror.

Relative strength or comparative strength analysis follows the strongest stocks in favor of weaker stocks and gives traders the best possible indication of what stock is going to continue moving higher in the near term.

Moving ahead, measuring volatility levels in comparison to past volatility levels can give you a much more accurate indication of whether the stock is going to continue trading higher or stagnate…with much better accuracy level than the great majority of technical indicators.

Over 30 years of back testing 3000 different stocks and 20 different commodities clearly demonstrates that sharp increase in volatility levels will causes most financial assets to lose their directional movement and begin congesting or reverse the trend in the opposite direction.

And lastly, we’ve learned that including the long bond in your account to hedge against downside risk can drastically increase the percentage of winning trades and decrease the overall risk and volatility level to your trading account, without having to rely on stop loss orders to protect against downside risk.

Each and every one of the three factors that I’ve covered today is grounded in extremely basic and prudent investment principles…that would even make Warren Buffet Proud!

Over the past several years, I’ve utilized the exact same principles that I’ve shared with you today with a few different trading models.

To give you some comparative numbers, during the past 6 years, the SP 500 increased in value close to 90 percent, actually the return is roughly 88%.

The Titan trading strategy, which is the trading model that I described in today’s article, generated over 2600% return during the exact same 6 year time period.

Imagine the returns if you traded options instead of the stocks, the returns could potentially be up to 10 times higher.

Keep in mind, we didn’t short stocks, use leverage or margin, avoided any type of black box systems, no waves, complicated math formulas…we simply took the most basic investment and trading principles and turbo charged them for oversized returns.

THE SPECIAL OFFER

The Forbidden Numbers (FREE Video Series)

From 2010 to today - this mysterious three-digit pattern would have turned every $10,000 you invested into $2.66 million. That's a whopping 26,600% in just 83 months.

Now history is set to repeat itself. You’re about to find out how one hedge fund insider spots 27.8%... 5.9%... even 41.3% pops in Blue Chip Stocks every two weeks.

ABOUT THE AUTHOR

Author: Todd Mitchell, CEO & Founder
Company: Trading Concepts
Website:TradingConceptsInc.com
Services Offered: Trading Courses, Live Trading Room, Daily Trade Videos 
Markets Covered: Stocks, ETFs, Emini Futures, Forex, Day Trading

Todd has been trading in all of the different markets over 30 years, building his experience and skills, and mastering the parallels that make certain techniques work no matter which market you trade.

Chapter
05

How to Trade a Bull market with Options

By Roger Scott, MarketGeeks.com

In the short video below, I’m going to teach you how to trade a bull market with Options, safely and effectively. Throughout my 20+ years of experience trading stocks, options, futures and Forex markets, I have successfully developed and back-tested several strategies for trading the markets.

I develop actionable strategies that you can apply right away, without boring or complicated theory. You will learn tactics that can help you achieve consistent returns over time. Best of all, these strategies work with stocks, options, futures and Forex.

In this video, you will learn:

  • How to identify stocks that are extremely bullish
  • How to spot low-risk entry opportunities with big profit potential
  • How to target undervalued options that are ready for big gains

THE MOVIE: HOW TO TRADE A BULL MARKET WITH OPTIONS


THE SPECIAL OFFER

For more information on How To Trade Bull Market With Options checkout Roger at his marketgeeks.com website to see all the wonderful information he has posted on his tips, techniques and strategies for trading the markets.

ABOUT THE AUTHOR

Author: Roger Scott, Founder
Company: Market Geeks, LLC
Website: MarketGeeks.com
Services Offered: Trading Courses, Mentorship,
Markets Covered: Stocks, Options, Futures, Forex

Market Geeks is widely known for providing traders around the world with the very best in short-term and day trading methodologies.

Chapter
06

Price Action Strategies

By Vince Vora, TradingWins.com

It's always amazing to learn about the habits of successful traders. From the thousands of traders that I've coached over the years, some of these common habits are risk-avoidance, sound money management and the ability to keep emotions in check. But more importantly than having these habits is having the discipline to apply them consistently.

I've found that there are many traders who would be considered mediocre for their stock picking skills but have been highly successful because they consistently apply good trade management principles. Conversely, the market is littered with traders who were very good at picking stocks but were not good at consistently applying good trade management skills.

The video here will show you how I use Price Action in my daily trading and, more importantly, why consistency is a key factor in trading success.

THE MOVIE: PRICE ACTION STRATEGIES


THE SPECIAL OFFER

Get the Magic of Price Action – Pro Training

Learn the full strategy from entry to exit, and is specifically designed for trading stocks, options, futures, and forex in today's volatile markets.

ABOUT THE AUTHOR

Author: Vince Vora, Senior Trader
Company: Trading Wins
Website: TradingWins.com
Services Offered: Trade Alerts, Daily Market Commentary, Nightly Videos
Markets Covered: Stocks, options, Forex, Futures

Over the last three decades, Vince has been trading and refining his trading systems that are based on technical analysis and price action. Over the last few years, his focus has been on teaching people how to become better traders.

Chapter
07

Maximum Profit To The Downside When Selling Premium: Writing Covered Puts

By AJ Brown, TradingTrainer.com

One of the most popular option trading strategies for creating ongoing consistent income is writing covered calls. In writing a covered call, our intention is twofold. We want to create a risk-free transaction where the alternatives are not maximum reward versus maximum risk but rather maximum reward versus minimum reward. We also want to create a transaction that lasts many premium cycles.

Here is the formula for Return on Invested Capital.

In trading vernacular, the "amount invested" can also be referred to as the "breakeven amount", "breakeven price", and "cost basis". When we write a covered call, we sell an option's premium for profit each cycle. At the end of each cycle, our cost basis is reduced by the profit from the previous cycle and we prepare to and ultimately sell premium for profit to start the next cycle. In the Return on Invested Capital formula, in a well architected covered call trade, the denominator reduces each cycle while the numerator stays constant or grows. Mathematically, this translates to exponentially increasing profits each cycle versus profits that grow linearly. Therefore, it makes sense that our intention is to have a transaction that lasts many cycles. That, and when we sell option premium in any form, by definition, we take on an obligation, a commitment, that we will perform on that option, if the buyer of that option exercises their right. Researching underlying security candidates that we feel confident about being in a commitment with, can be an arduous task. Another reason our intention is to create a transaction that lasts many premium cycles is to minimize how often we are called on to vet underlying candidates and therefore be picky about the one's we do pursue.

This is a topic we discuss often as part of our Trading Trainer '6 Percent Protocol' program.

How do we create transactions that are risk free and that last many premium cycles? In scenario testing, an imperative for bound trading strategies, like writing covered calls, one of our outcomes is to define a trade's "channel zone", "trade zone" and "profit zone". The "channel zone" is simply the tested support to the tested resistance prices of a horizontal channel.

The "trade zone" is our bail-out price to our exercise price. Our bail-out price is where we have typically set semiautomatic or automatic unwinding mechanisms, to close positions and put us into a safe all cash position. We typically set our bail-out price where price action has not been since the underlying began channeling horizontally. We do not want to trigger a bail-out unless the unthinkable has happened. The exercise price is where our position is unwound by meeting the obligation of the sold premium trade, when our buyer decides it makes sense to transact their option contract(s).

Our "profit zone" is our cost basis to our exercise price. Our cost basis is our breakeven price; the amount we have invested. In a premium trade, our cost basis decreases each cycle we earn profits and apply the previous cycle's profits to the amount we have invested in the transaction.

When architecting a trade that profits on selling the theta decay component of an option's premium (the premium goes to zero as time passes and the option reaches its expiration date), quantified, our intention is to have our "profit zone" be larger than our "trade zone" which creates a risk-free trade, and our "trade zone" to be larger than our "channel zone" which creates a trade that lasts many premium cycles and gives us exponential profits over its life.

Over time, our "profit zone" will grow bigger than our "trade zone", as pointed out earlier, by our cost basis decreasing each time a cycle's profit is applied and a subsequent cycle's profit is secured. Many theta-decay premium trade architects therefore focus on making their "trade zone" which consists of selected values, larger than their "channel zone" which is pre-defined. This is where writing covered calls receives favor by seasoned trade architects. They are easy to leg into. 

We buy underlying securities, call options, and sell or write put options, when prices are low but will go higher, after a technical bottom has been found. We sell or short securities, sell or write call options, and buy put options, when prices are high but will go lower, after a technical top has been found. By legging into a covered call writing transaction (buying the underlying security when a bottom has been found at channel support and selling the call premium when a top has been found at channel resistance) we can optimally have our "trade zone" larger than our "channel zone". As a side effect to legging in with a focus on having our "trade zone" larger than our "channel zone", it often works out that our "profit zone" is larger than our "trade zone". If our "profit zone" is not larger than our "trade zone" at the beginning of our first premium cycle, a well architected and managed trade will see the "profit zone" larger than the "trade zone" by the second or third premium cycle.

The key to protecting our investment and carefully building consistent income is to architect a theta-decay premium selling trade, create a plan for the transaction, and then follow the plan diligently step-by-step, being ready with alternative plans to deal with the unexpected. Learning to do this is the whole purpose of the '6 Percent Protocol' community at Trading Trainer.

Architecting Theta-Decay Premium Trades That Exercise To The Down Side

Investors are worried about that black swan event that will cause the market to breakout down unexpectedly. The bear tends to jump out the window while the bull tends to climb up the stairs. How do we protect our investment even in the most well-constructed transaction, if it is possible that we will not be risk-free from the outset? We can put together a transaction that exercises at maximum profit, rather than gets bailed-out at maximum risk, to the down side. Covered put writing behaves this way.

Writing a covered put is like writing a covered call in that we search out a sideways-channeling underlying security that has clearly defined tested support and resistance. We do a soft data analysis to make sure there are no upcoming events that may trigger price action outside of our channel. Because we are looking to construct a trade that will last many cycles, we take our time and observe our underlying security candidate over time (at least one cycle) for any unexpected behaviors. We remember that once we have sold premium against this underlying security in any way, we have an obligation to make good on our commitment until we either unwind the transaction or the premium expires worthless. We do not take that commitment lightly, so we screen our underlying symbols thoroughly.

Once the underlying security is selected, we start writing a covered put by shorting the underlying security. This requires a margin trading account. We short an underlying security by "selling-to-open" it. We are borrowing an underlying security from our broker and selling it. To close our position, we buy it back; we "buy-to-close" it. While the position is sold, our broker holds an open tab for us, for the price of the underlying security. Our broker may make a margin call at any time, asking us to pay our tab. Often that requires us to buy back the security to fulfill our obligation. We short our underlying symbol after a technical top has been found to get the highest price we can while making sure the security will go lower in price.

The second step is to sell our put option premium. We sell our put option premium once a technical bottom has been found. The most premium will be found with an at-the-money put option. Most traders use the first out-of-the-money option because, by definition, an out-of-the-money option has no intrinsic value; the price of the option is all premium. Also, an out-of-the money option will have its exercise price lower than channel support if that is where the underlying symbol bottomed.

Our cost basis, because we shorted the underlying symbol and we sold the put option, becomes the summation of the two. Our "profit zone" is from the cost basis down to our exercise price. Notice that the exercise price is to the downside and the cost basis is to the upside.

It is worth taking a moment to review how a covered put trade is exercised. As with any American option, the buyer of a put has the right at any time between now and the expiration of the option, to give the seller a share of an underlying security and, in return, get the exercise price amount. They pay the option price for this right. Typically, the buyer would exercise this right if the underlying security was trading for less than the strike price of the option minus their premium paid. It makes sense that the buyer wants to sell their underlying security for the highest price possible when all costs are factored in.

A seller can assume that they will be exercised at expiration if the underlying security is less than the strike price of the option sold. Dividends may also play a role as to whether an option is exercised and at what price. If the buyer exercises their right, it makes sense that the seller would take that underlying security they receive and fulfill their obligation to their broker for their shorted security.

Because our exercise price is to the downside, we must pick a bail-out price to the upside. We set our bail-out price to the upside where price action has not been since the underlying security began channeling horizontally. We do not want to trigger a bail-out unless the unthinkable has happened. We set semiautomatic or automatic unwinding mechanisms at our bail-out price, to close positions and put us into a safe all cash position. For a covered call position, we would buy-to-close the call option (usually for very little) followed by selling-to-close the underlying security. For a covered put position, we would buy-to-close the put option (again, usually for very little) followed by buying-to-close the shorted underlying security. Our "trade zone" is from our bail-out price down to our exercise price.

Our maximum reward occurs when we are exercised to the downside. Our maximum risk (if our cost basis is less than our bail-out price; our "profit zone" is smaller than our "trade zone") or our minimum reward (if our cost basis is greater than our bail-out price; our "profit zone" is larger than our "trade zone") occurs when we are bailed-out to the upside. We are protected against black swan events where the bear surprisingly jumps out the window. In theory, we have more time to react to and adjust for an upside movement, as well, because bulls climb up the stairs in a more calculated way.

In architecting the optimal covered put, our intention is to have our exercise price below channel support and our cost basis above our bail-out price which is above channel resistance. This covered put transaction not only has its maximum reward to the downside, it is risk free, and it will last for many premium selling cycles.

These are the trades we repeatedly practice constructing as part of the Trading Trainer '6 Percent Protocol' program.

THE SPECIAL OFFER

Scenario testing is a key piece of our ‘Six Percent Protocol’ program. It is built in. Sign up here for instant access to our detailed video series. No wait. No hassle. Watch all the videos at once.

ABOUT THE AUTHOR

Author: A.J. Brown, Founder
Company: TradingTrainer.com
Website: TradingTrainer.com
Services Offered: Trading Education, Nightly Newsletter, Daily picks
Markets Covered: Stocks, Options

A.J. Brown is the creator of Trading Trainer and he has been trading options for more than 10 years.

Chapter
08

Naked Put Writing: A Strategy for All Hours

By Lawrence McMillan, McMillanAsset.com


The sale of a naked put is often a very attractive strategy that is conservative, can out-perform the market, can have a high-win rate, and can be analyzed and sometimes constructed in non-market hours. In this article, we’re going to look at some of the background on put writing, show a systematic way to select which puts are best to write, and finally explain how you can implement them into your trading arsenal “outside normal hours.”

Option Selling is Conservative

The basic concept of option writing is a proven investment technique that is generally considered to be conservative. It can be implemented as “covered call writing” or, alternatively, “naked put writing” which is the equivalent strategy to covered call writing.

In either case, one is selling a wasting asset, and over time the cumulative effect of this selling will add return to a portfolio, as well as reducing the volatility of a purely equity portfolio.

People sometimes stay away from uncovered put writing because they hear that it is "too risky" or that it doesn't have a sufficient risk-reward. The truth is that put selling, when secured by cash, is actually less risky than owning stock outright and can out-perform the broad market and the covered-writing index over time.

Covered Writes vs. Naked Put Sales

First of all, it should be understood that the two strategies – naked put writing and covered call writing – are equivalent. Two strategies are considered equivalent when their profit graphs have the same shape (Figure 1). In this case, both have fixed, limited upside profit potential above the striking price of the written option, and both have downside risk below the striking price of the written option.

FIGURE 1

One very compelling, yet simple argument in favor of naked put writing is this: commission costs are lower. A covered write entails two commissions (one for the stock, the other for the written call). A naked put requires only one. Furthermore, if the position attains its maximum profitability – as we would hope that it always does – there is another commission to sell the stock when it is called away. There is no such additional commission for the naked put; it merely expires worthless.

Nowadays, commission costs are small in deeply discounted accounts, but not everyone trades with deep discount brokers. Moreover, even there, it doesn’t hurt to save a few dollars here and there.

So, a naked put sale will have a higher expected return than a covered call write, merely because of reduced commission costs.

Another factor in utilizing naked puts is that it is easier to take a (partial) profit if one desires. This would normally happen with the stock well above the striking price and with a few days to a few weeks remaining before expiration. At that time, the put is (deeply) out of the money and will generally be trading actively, with a fairly tight market. In a covered call write, however, the call would be deeply in-the-money. Such calls have wide markets and virtually no trading volume.

Hence, it might be easy to buy back a written put for a nickel or less, to close down a position and eliminate further risk. But at the same time, it would be almost impossible to remove the deeply in-the-money covered call write for 5 or 10 cents over parity.

The same thinking applies to establishing the position, which we normally do with the stock well above the striking price of the written option. In such cases, the call is in the money – often fairly deeply – while the put is out-of the money. Thus the put market is often tighter and more liquid and might more easily be “middled” (i.e., traded between the bid and ask). Again, this potentially improves returns.

The above facts regarding naked put writing are generally known to most investors. However, many are writing in IRA or other retirement accounts, or they just feel more comfortable owning stock, and so they have been doing traditional covered call writing – buying stock and selling calls against it.

But it isn’t necessary, and it certainly isn’t efficient, to do so. A cash-based account (retirement account or merely a cash account) can write naked puts, as long as one has enough cash in the account to allow for potential assignment of the written put. Simply stated, one must have cash equal to the striking price times the number of puts sold (times $100, of course). Technically, the put premium can be applied against that requirement.

Most brokerage firms do allow cash-based naked put writing, however some may not. Some firms may require that you obtain “level 2" option approval before doing so, but that is usually a simple matter of filling out some paperwork. If your brokerage does not allow cash-based put-selling, you can always move the account to one that does, like Interactive Brokers.

Once you write a naked put in a cash account, your broker will “set aside” the appropriate amount of cash. You can’t withdraw that cash or use it to buy other securities – even money market funds.

Most put sellers operate in a margin account, however, using some leverage (if they wish). One of the advantages of writing naked puts on margin is that the writer can gain a fair amount of leverage and thus increase returns if he feels comfortable with the risk (as a result, we have long held that naked put writing on margin makes covered call writing on margin obsolete). That is not the case with cash-based naked put writing, though. The returns are more in line with traditional covered call writing.

In summary, put writing is our strategy of choice over covered call writing in most cases – whether cash-based or on margin. Later, when we discuss index put selling, you will see that there are even greater advantages to put writing on margin.

Put-Selling Can Out-Perform the Market

The Chicago Board Option Exchange (CBOE) has created certain benchmark indices so that investors can compare covered call writing ($BXM), naked put selling ($PUT), and the performance of the S&P 500 Index ($SPX). Figure 3 compares these indices, with all three aligned on June 1, 1988.

FIGURE 2

It is clear from the Figure 2 that naked put writing ($PUT) is the superior performer of these benchmark indices. For this reason, naked put writing is the preferred option-writing strategy that we employ in our newsletter services.

Since covered call writing is equivalent to naked put selling – and since Figure 2 merely shows dollars of profit, not returns – you might think that the covered call writing graph and the naked put writing graph would be quite similar.

But there is something more to index put writing – especially writing puts on the S&P 500 index ($SPX or SPY, or even e-mini S&P futures): out-of-the-money puts are far more expensive than out-of-the-money calls.

This is called a “volatility skew,” and it has been in effect since the Crash of ‘87. Institutional put buyers want to own $SPX (and related) puts for portfolio protection, and they don’t seems to care if they constantly pay too much for them. Conversely, other large institutions may be selling covered calls as protection, thereby depressing the prices of those calls. Some institutions do both – buy the puts and sell the calls (a collar). Thus the main reason that $PUT outperforms $BXM by so much in Figure 3 is that the out-of-the-money puts being sold are far more expensive (in terms of implied volatility) than are any out-of-the-money calls being sold.

We recommend put ratio spreads and weekly option sales in The Daily Strategist newsletter as a way to take advantage of this. Moreover, we have put together a complete strategy – called Volatility Capture – that we use in our managed accounts.

In the Volatility Capture Strategy, we blend all aspects together to produce a reduced volatility strategy that can make money in all markets (although it will not keep pace on the upside in a roaring bull market). The primary focus of the strategy is selling $SPX puts, but there are two forms of protection in place as well.

McMillan Analysis Corp. is registered as both a Registered Investment Advisor (RIA) and as a Commodity Trading Advisor (CTA), so we are able to offer the strategy to both non-retirement and retirement accounts.

Our complete track record and other pertinent details are available by request. For preliminary information and a summary of our track record, visit our money management web site: http://www.mcmillanasset.com.

For more specific information, email us at the following address: [email protected]., or call us at 800-768-1541.

Positions Can Be Hedged

One of the main arguments against put-selling is that the draw-downs can be large in severe market downturns. One way to mitigate these draw-downs would be to hedge the entire put-sale portfolio. For example, one may attempt to offset the market risk that is inherent to option writing by continually hedging with long positions in dynamic volatility-based call options as we do in our managed accounts.

This is really a topic for another article, but the gist of this protection is to buy out-of-the-money $VIX one-month calls and roll them over monthly. Buying longer-term $VIX calls does not work, for only the front-month contracts come anywhere close to simulating movements in $VIX (and in $SPX).

The Odds Can Be in Your Favor

As evidenced by the $PUT Index, naked-put writing is a conservative strategy that has the potential to out-perform the broad market over time. When implemented correctly, the strategy can have high rates of success and can also be hedged against large stock market-drawdowns. For example, The Daily Strategist and Option Strategist Newsletters have produced a combined 89.4% and 85.6% winners in their index and equity naked put-selling/covered-writing trades since the newsletter started recommending them in May of 2007 and April of 2004 respectively. Investors looking for put-selling trading ideas and recommendations on a daily or weekly basis may be interested in subscribing to one of those services.

Trading Outside Normal Hours

Naked put-selling is an especially attractive strategy for do-it-yourself investors who do not have time in their day to watch the markets since positions do not need to be monitored closely all day.Put-writers can sit easy so long as the underlying stock remains above the strike price of the option sold. If the stock is above the strike price at expiration, the option simply expires. The option-seller then realizes the initial credit and no closing action needs to be taken. If the position needs to be exited early, usually due to the fact that the stock has dropped below the strike price of the short option, the position can be closed out automatically via a contingent stop loss order.

You cannot trade options outside of standard stock market hours; however depending on your brokerage, you may be able to place your opening limit order outside the stock market hours. In this case, you order would simply be placed in a queue for processing once the market opened. If your broker doesn’t allow you to place an order outside market hours, you would only need a couple of minutes during the day to either call your broker or hop on your trading software to place your trade.

Another big benefit to naked put-selling is that it doesn’t take much analysis to find good potential trading candidates. In fact, as we do for our newsletters, all of the initial analysis can be done at night with computer scans and a little bit of discretion. The following section will discuss our approach to finding naked put-sale candidates for our newsletters each night.

Choosing What Put To Sell

For the most part, we choose our put-selling positions for our various publications based on data that is available on The Strategy Zone – a subscriber area of our web site consisting of various data scans and lists of potential trades compiled by our computer analysis. One could do the same sort of analysis yourself, as a subscriber to “the Zone.” On top of that, our Option Workbench provides additional analytical capability for that data.

Our computers do a lot of option theoretical analysis each night – from computer Greeks to analyzing which straddles to buy to graphs of put-call ratios. The Zone was started about 10 years ago, when I decided to make the outputs of our nightly programs available to anyone who was interested in paying a modest amount of money to view them. These analyses are still the basis for almost all of our recommendations.

Expected Return

Expected return is the crux of most of these analyses. For those of you not familiar with the concept, I will briefly explain it here.

Expected return is a logical way of analyzing diverse strategies, breaking them down to a single useful number. Expected return encompasses the volatility of the underlying instrument as a major factor. However, it is only a theoretical number and is not really a projection of how this individual trade will do. Rather, expected return is the return one could expect to make on a particular trade over a large number of trials.

For example, consider a fair die (i.e., one that is not “loaded”). There is an equal, one-sixth chance that any number will come up on a particular roll of the die. But does that mean if I roll the die six times, I will get one once, two once, three once, etc.? No, of course not. But if I roll the fair die 6 million times; I will likely have rolled very nearly 1 million ones, 1 million twos, etc.

We are applying this same sort of theory to position analysis in the option market.

My Approach

For naked put selling, the first thing I look at is the file of the highest potential returns. These are determined strictly mathematically, using expected return analysis. This list is going to necessarily have a lot of “dangerous” stocks listed as the best covered writes. Typically, these would be biotech stocks or other event-driven small-cap stocks.

Next, I reduce the size of the list. I have a program that screens out a subset of these, limiting the list to stocks in the S&P 500 Index only. Individual investors might have other ways of screening the list.

If returns at the top of the list are “too good to be true,” then one can assume that either 1) there is a volatile event on the horizon (meaning the lognormal distribution assumption is wrong), or 2) the volatility assumption used in the expected return analysis is wrong. Throw out any such items. These would likely have annualized expected returns in excess of 100% – an unrealistic number for a naked put write. However, weekly put sales might sometimes be in that range. Those would have to be looked at separately. In general, if the underlying stock is going to report earnings during the week in question, the put sale should probably be avoided.

At this point, I select all the writes with annualized expected returns higher than 24% (my minimum return for writing puts on margin), and re-rank them by probability of profit. Once that is done, I select those with a probability of profit of 90% or higher, and re-rank them by annualized expected return. In other words, I am still interested in high returns, but I want ones with plenty of downside protection. This screening process knocks out most of the list, usually as much as 90% of the initial put writing candidates.

From there the analysis calls for some research, for at this point it is necessary to look at the individual stocks and options to see if there is something unusual or especially risky taking place. Some stocks seem to be on the list perennially – Sears (SHLD), for example, perennially has expensive options due to its penchant for drastic moves.

Another useful piece of information is the Percentile of Implied Volatility. That is listed in the data, and if it is low (below the 50th percentile), then I will likely not write that particular put. Recall that expected return needs a volatility estimate – and for these naked put writes we use the current composite implied volatility. However, if there is the possibility that volatility could increase a lot (i.e., if the current composite implied volatility is in a fairly low percentile), then there is a danger that actual stock movements could be much more volatile than we have projected. Hence that is not a naked put that I would want to write.

I also look at the absolute price of the option. I realize that is taken into account in the expected return analysis, but I personally do not like writing naked options selling for only 20 cents or so, unless it’s on a very low-priced stock.

The expiration date of the option is important to me as well. I would prefer to write one- or two-month options, because there is less time for something to go wrong. Occasionally, if there is a special situation that I feel is overblown on the downside I will look into writing longer-term options, but that is fairly rare.

These further restrictions reduce the number of writing candidates down to a fairly manageable level. At this point, it is necessary to look at the individual charts of the stocks themselves. It’s not that I am trying to predict the stock price; I really don’t care what it does as long as it doesn’t plunge.

Consequently, I would not be interested in writing a put on a stock, if that stock is in a steep downtrend. More likely, the chart can show where any previous declines have bottomed. I would prefer to see a support level on the chart, at a price higher than the striking price that I am considering writing. This last criterion knocks out a lot of the remaining candidates.

Some may say that the stock chart is irrelevant, if the statistical and other criteria are met. That’s probably true, but if I have my choice of one that has chart support above the strike and one that doesn’t, I am going with the one that does every time.

The potential put selling candidates that remain at this point are generally few, and are the best writing candidates. But I will always check the news regarding any potential write, just to see if there is something that I should know. By “news,” I mean earnings dates, any potential FDA hearing dates, ongoing lawsuits, etc. You can easily get a lot of this information by looking up the company on Yahoo Finance or other free financial news sites.

The reason that this news check is necessary is that these puts are statistically expensive for some reason. I’d like to know what that reason is, if possible. The previous screens will probably have weeded out any FDA hearing candidates, for their puts are so dramatically expensive that they would have alarm-raising, overly high expected returns.

But what about earnings? Studies show that the options on most stocks increase in implied volatility right before the earnings. In general this increase is modest – a 10% rise in implieds, or so. But sometimes the rise is much more dramatic. Those more dramatic situations often show up on volatility skew lists and are used as dual calendar spreads in earnings-driven strategies. But as far as naked put writing goes, if the expected return on the put is extraordinary, then that is a warning flag.

If a position meets all of these criteria, we officially consider it acceptable to establish and may recommend it in a newsletter.

I realize that many put sellers (or covered call writers) use a different method: they pick a stock they “like” first, and then try to find an option to write. By this “fundamental” approach, one is probably writing an option that has a very low expected return – a la the calls on almost every “dividend stock” in the current market. They compensate for this by writing the call out of the money, so that they will have some profit if the stock rises and gets called away.

To me, that is completely the wrong way to go about it. If you like the stock, why not buy it and buy a put, so you have upside profit potential? What is the obsession with writing a covered call?

Rather than that “fundamental” or “gut” approach, the use of expected return as a guide to the position makes this a “total return” proposition – where we are not overly concerned with (upward) stock movement, but rather more concerned with the combination of option premium, stock volatility, rate of return, and probability of winning. To me, that is the correct approach.

Do-It-Yourself with Option Workbench

Those looking to analyze potential naked put-writes themselves, can do so with easewith our Option WorkBench (OWB) software. This is the overlay service to our Strategy Zone, and it provides the ability to sort the reports in various ways. More importantly, it allows one to construct his own analysis formulae.For information on the various features and capabilities of OWB, watch this video.

Selecting Naked Put Writes From OWB

Option workbench makes finding actionable naked put-sale trades that fit all of the criteria in my aforementioned approach quite easy. Once you are logged into the software, one would first access the “broad” scan of potential candidates by hovering over “Spread Profiles” and clicking on Naked Puts.

A list of all the naked put writes that have annualized expected returns of greater than 4% will be shown (that 4% threshold would move higher if T-Bills ever yield anything besides 0%!).

Using the closing data from June 17, 2015, there were 14,449 such put writes! Obviously, one has to cut that list down to a more workable size.

There are a lot of 32 column headings here, and most are statistical in nature. To me, the two most important pieces of data are 1) annualized expected return, and 2) downside protection (in terms of probability – not percent of stock price). Both of these are volatility-related, and that is what is important in choosing put writes. You want to ensure that you are being compensated adequately for the volatility of the stock.

If you click on “A ExpRtn” (which is Annualized Expected Return), the list quickly sorts by that data. However, in my opinion, it is not a good idea to just sell the put with the highest expected return. The computer calculations make certain assumptions that might not reflect the real world. For example, if there is a large possibility that the stock might gap downwards (an upcoming earnings report, for example), the puts will appear to be overly expensive. Any sort of upcoming news that might cause the stock to gap will raise the price of the puts. You probably don’t want to write such puts, even though the computer may “think” they are the best writes to establish.

In order to overcome these frailties, one would use the “Filter Editor” function of OWB. You can construct a filter to include or exclude writes the do/don’t meet your individual criteria.

Figure 3

If you click on the button (above the data) that says “Profile Filter Editor,” a box will appear. Figure 3 shows the box as it appears in my version of OWB. On the left are three filter names: DTOS Noearnings, DTOS w/ earnings, and TOS No Earnings (mine). In the center of Figure 3, the actual formulae for the filter “TOS No Earnings" are shown.

To apply the formulae, merely click the “Apply” button (lower right of Figure 3). In this case, the list of 14,449 potential naked put writes shrinks to 64 candidates!

Here are the formulae that appear in Figure 3:

InList (‘S&P 500'): include only stocks that are in the $SPX Index. This way, we are not dealing with extremely small stocks that can easily gap by huge amounts on corporate news.

Days>2, days <= 90: include only writes whose expiration date is between 2 and 89 days hence.

Aexprtn>= 24%: only include writes whose annualized expected return is at least 24%

PrDBE>= 90%: only consider stocks that have less than a 10% chance of being below the downside breakeven (DBE) point at expiration.

PutPrice>= 0.25: only consider puts that are selling for at least 0.25.

expdate < nextearnings: only consider put sales on stocks that are not going to report earnings while the put sale is in place. Stocks are far too volatile on earnings announcements, and this will avoid the main cause of downside gaps: poor earnings.

These criteria produce a strong list of put writing candidates. There will be no earnings announcements to cause downside gaps. There is a 90% chance of making money. Over time, writes such as these should produce returns in line with the expected returns – greater than 24%, using this formula.

You can add many other filters (or delete some of these if you wish). It is easy to do within OWB, and I encourage you to experiment with it.

Once the list has been filtered, there is still work to do. Why are these remaining puts so expensive? One might have to look at the news for certain stocks to see why. At the current time, health care stocks have very expensive options: ET, HUM, THC, for example. Not only are these inflated because of takeover rumors, there is also supposedly some Medicare-related pricing edicts coming soon from the U.S. Government. Those things could cause downside volatility; however one may feel there is enough downside protection to warrant selling the puts. If that were the case, you would have found your trade!

Placing Your Trade

After you have found your trade the next step would be to determine how many puts to sell. Generally, for a margin account, most brokerages have a margin requirement of 25% of the strike-priceof the short put you are selling less the premium received for the sale of the put less the out-of-the-money amount, subject to a 10% minimum. We generally write out-of-the-money puts and set aside enough margin so that the stock has room to fall to the striking price – the level where we generally would be closing the position out. This conservative approach decreases the risk of a margin call if the stock moves against your position.

For example, if you sell a naked put with a strike price of 50 for a credit of 1.00, the margin we would set aside would be $1,150. The formula below illustrates this:

Strike Price (50) x 25% (0.25) x Shares per Option (100) – Premium Received (100) = Margin Requirement ($1,150)

For cash accounts, one would have to set aside 100% of the strike price less the put premium. So, for the prior example, the cash collateral would be $4,900 (50 x 100 – 100).

We generally suggest that one puts no more than 5% of their total portfolio value in any particular put-sale for margin accounts, and 10% for cash accounts.

If you had a $100,000 margin account, you would want to allocate no more than $5,000 to any particular put sale. Using the prior example, you would then sell 4 naked puts ($5,000 / $1,150 = 4.35). Cash based accounts would sell 2 contracts (($100,000 x 0.10) / $4,900 = 2.04).

The next step would be determine your stop. Generally, we like to set our stops at the downside break-even level at expiration. This level can easily be calculated with the following formula:

Strike Price – Put Premium = Downside Break-Even Level

However, if you cannot watch your position throughout the day, it may make sense to set your intraday stop at the strike price. This means that if the stock trades below the strike price you are short, the position would be automatically closed. That way, there would be no risk of assignment if the stock were below your strike at expiration.

Now that you have determined your quantity and stop, the final steps would be to enter your order (before the open with your brokerage’s order queue if possible), set your stop (via a contingent stop order if your brokerage allows) and monitor. Those who cannot generally participate during normal market hours and whose brokerages don’t allow order queuing and contingent stops, would only need a few minutes to initially place the trade. Furthermore, they would only have to monitor the trade near the market close each day to see if the stock is below their stop. If it were, one would simply buy back the put to close the position.

THE SPECIAL OFFER

Find naked put-sale candidates on your own with a free 30-day trial to Option Workbench. Feel free to use my filter or create one of your own!

Scroll to the bottom and select the one month subscription ($135) and enter the Coupon Code FREEOWB at checkout. No credit card is required. Subscription will not automatically renew upon completion.

ABOUT THE AUTHOR

Author: Lawrence McMillan, Founder
Company: McMillan Asset Management
Website: McMillanAsset.com
Services Offered: Trading Education, Account Management Services
Markets Covered: Stocks, Options

Lawrence is well-known as the author of “Options As a Strategic Investment”, the best-selling work on stock and index options strategies. The book – initially published in 1980 – is currently in its fifth edition and is a staple on the desks of many professional option traders.

Chapter
09

The Triple Confirmation System

By Andrew Keene, AlphaShark.com

When I talk about trading, I’m talking about math, probabilities and putting the odds of success in my favor. If I flip a coin, 100 percent of the time, my odds of success will be 50/50.

But what happens if you flip a coin 100 times, and it lands up tails 70 times out of 100? What are the odds of the next flip landing up tails? The odds are still 50/50. That’s why it is possible to make money in the short term in Las Vegas, but in the long-term, the casinos always win.

When I’m trading, I want high probability setups, supported by math to keep the odds in my favor. For example, if the candlesticks on a chart are making higher highs and higher lows, what are the odds that the market will continue to move higher? I need to know this to stay on the side of a trend, and the best indicator to help me see that at a glance is the Ichimoku Cloud.

In this video, I will show you how to scan for the best trending stocks, using my  proprietary Ichimoku Cloud Triple Confirmation Indicator.

THE MOVIE - THE TRIPLE CONFIRMATION SYSTEM

THE SPECIAL OFFER

ABOUT THE AUTHOR
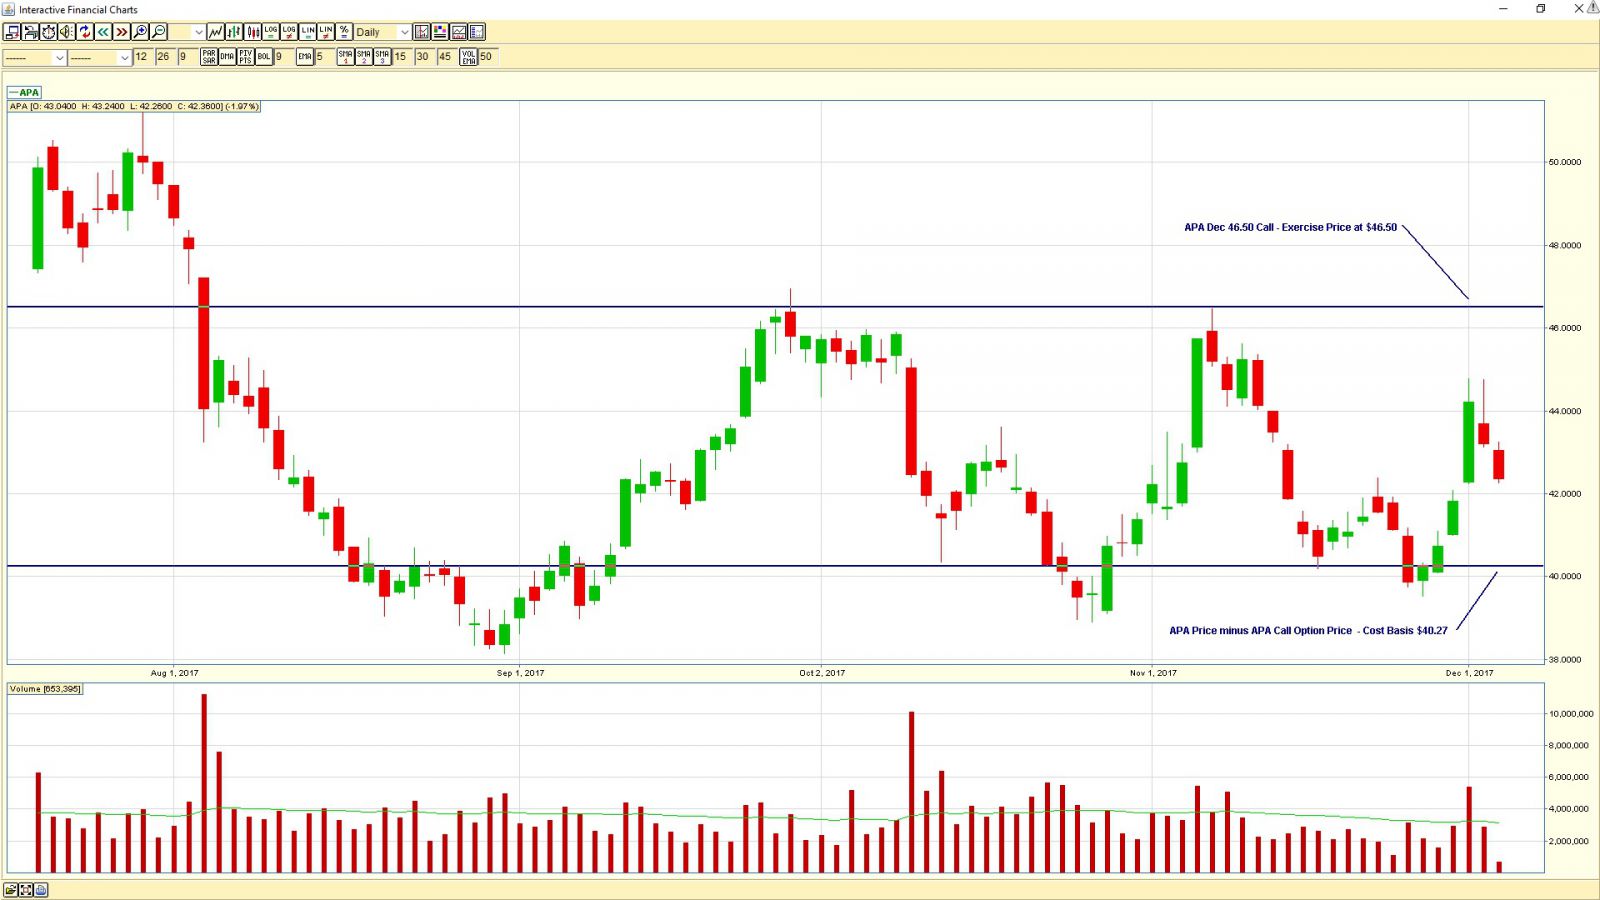
Author: Andrew Keene, Founder & CEO
Company: Alpha Shark Trading
Website: AlphaShark.com
Services Offered: Trading Room, Market Scanners, Trading Education
Markets Covered: Stocks, Options, Futures, Currency pairs

Andrew’s first love will always be trading, but he is better known for building a trading room. He has taught his personal strategies to over 50,000 students over the past four years.

Chapter
10

High Performing Options Strategy: The Hidden Pivot

By Rick Ackerman, RickAckerman.com

The Hidden Pivot strategy is a high-leverage options strategy that I use in conjunction with my daily service, Rick’s Picks. Our edge comes from a price targeting system that is purely technical, combined with the experience that I have amassed in over 30 years of Options trading.

What is a Hidden Pivot?

When the price of a stock fluctuates, it is acting to rebalance ceaseless changes in the yin/yang energy of supply and demand. Stocks “inhale” and “exhale” as they fluctuate through time. It therefore follows that if there’s a zig on the charts, there is precisely a corresponding zag somewhere else.

Hidden pivots are at the exact middle and end points of these zigs and zags. Determining the location of Hidden Pivots can tell us with remarkable precision the prices at which a stock is most likely to change direction.

In this short video, I will cover the Hidden Pivot strategy, along with a bonus “Jackpot” strategy that I share with my subscribers on Fridays.  Some of the concepts you will learn in this video include:

  • Trade only weekly options expiring in 10 days or less
  • Initiate trades only when you expect them to be profitable within minutes
  • If options double, take profits on half of your position
  • Ditch the Black-Scholes model and use technical price targets instead
  • The “Jackpot” trade

THE MOVIE: HIGH PERFORMING OPTIONS STRATEGY: THE HIDDEN PIVOT


THE SPECIAL OFFER

Get a Free Demonstration of the Hidden Pivot Method Here!

Also, make sure to:

ABOUT THE AUTHOR

Author: Rick Ackerman, Founder
Company: Rick’s Picks
Website: RickAckerman.com
Services Offered: Market Forecasting, Chat Room, Education Services
Markets Covered: Stocks, Options, Commodities and eMini Futures

Rick’s detailed strategies for stocks, options and indices have appeared since the early 1990s in black Box Forecasts, a newsletter he founded that originally was geared for professional options traders.

Chapter
11

TRADING THE OPEN OF THE U.S. EQUITIES MARKET

By Melissa Armo, TheStockSwoosh.com

A random walk. That is what most people think the stock market is. Just a series of random events with no predictable pattern or link. Just total randomness.

Well, the fact is that most people are right. Most of the time during the trading day the market is random and has no predictable pattern.

This is why so many lose. I have traded the market for years, but realized long ago that MOST of the time the market is random, and people try to make too much out of insignificant patterns that give little odds of success. However, success comes from those few times where there is NOT randomness, when there IS a predictable pattern. When you find these times, it is when you have an edge.

To me, there are two primary times when you have this – two times when you have an edge, when equities give reliable patterns. One of those times comes from what we call ‘shock value’. Shock value can happen first thing in the morning in the U.S. equities market.

Because the stock market closes at 4:00pm EST and opens at 9:30am EST, there is a period where trades cannot take place. Yet events still occur. News still happens, stocks are still upgraded and downgraded, companies are still sued, and companies release earnings. As a matter of fact, companies intentionally release earnings when the market is closed. 99% of earnings are released during non-market hours. Any one of these events can cause tremendous demand to buy or sell a stock, yet it cannot be done. The market is closed.

Yes, there is post- and pre-market trading. But even if you include that, there is still a long period of time when there is no trading. And the post- and pre-market trading is not always reliable. It is generally light volume, and some participants are not able or willing to participate. Either way, the tremendous pent-up demand causes a void in the price chart. This means at open, traders and investors can be instantly rewarded, or punished. This creates four groups of traders/investors. There are those that have to buy, those that have to sell, those that want to buy, and those that want to sell.

This can lead to big swings in these equities at or near the open. Let’s be clear about something. We’re not talking about predicting the actual gap. In all my years, I have to tell you, it is not possible to predict the actual gap. That is nothing more than gambling. No research, no indicators, nothing but actual inside information can help you predict the gap. We are talking about how to play the stock once it gaps, regardless of whether you knew it was going gap. Here are a couple of examples.

In this example, GRPN gapped down (right arrow) and after the gap down, it moved another 20% over two days. Notice that, over two months ago, the stock gapped up and moved over 30% in one day; again, that is not counting the gap itself. Note also that if you owned the stock over four months, you would be only break even at best. If you played the stock the day of the gap up or the gap down for just the day, you played a stock that moved more in one day than most stocks do in an entire year.

This works in both directions. While ‘fear’ can drive prices lower at a faster rate, the proper bullish gaps can have the same effect.

YELP moved over 13% on the day it gapped. That is, from the time it opened, the entire move is able to be captured beginning at market open after the gap occurred. Notice something else. More than half of that move, over 7.5%, occurred in 20 minutes.

This should be amazing to you if you’re not aware of it already.

This is not a rare event. There are usually multiple stocks per day that this happens to. Because earnings announcements create an event that can cause additional gaps, this occurrence is usually more frequent during the time known as “earnings season,” which happens for about four weeks every three months.

Remember, big funds always have rules, and they often require that the fund cannot hold a position that goes a certain amount against them. This means big money is often forced to exit whether they want to or not. This often causes a snowball effect as the decline in price causes so much pain for other traders, that they sell, which creates more of a drop, which causes more pain and other traders to sell, etc. Take a look at the power of the recent STX daily chart.

Power. The power of big money. And if you know what you are doing, it can be one of the most predictable moves. These charts you are seeing are all the subject matter of plays that were discussed or traded on the morning that these gaps occurred in the Stock Swoosh Live Trading Room. This stock had two separate gaps that both created huge moves in a relatively short period of time. It is very common for a lot of that movement to happen first thing in the morning. Take a look at the 15-minute chart on the day of the second gap of STX.

That one single 15-minute bar moved over $3.00, or almost 13%. That was the bulk of the move for the day. By looking at the long- and short-term patterns prior to the gap, you can often get clues, usually very accurate clues, as to how the stock will react at open.

The stock called FEYE had a different type of gap. You can see the gap here on the daily chart, and yes, it produced another big red bar.

Now notice the five-minute chart. It started off green. Buyers.

This was very predictable if you look at the daily chart. Yes, there were ‘buyers,’ but that doesn’t mean they were bullish. Who buys a stock and is not bullish? Simple. It’s traders who had short positions and had to ‘buy’ to exit the position. Looking at the chart, it was clear there were many with short positions. Couple that with a ‘big’ gap, and you get profit takers. Add to that those mistakenly thinking that this is a buying opportunity, and you get a morning bounce. But buying soon runs out. And those that bought because they were bullish are soon proved wrong and they add fuel to the fire by having to exit and add more pressure to the selling. Look at the pure powerful selling going into 10:30.

And finally one more example. Here is the daily chart of FIT.

Again, knowledge of the gap and understanding the daily chart is key. This stock was a little ‘all over the place’ during the first hour, but there were two great entries.

However, knowing and understanding what is happening this is very playable. The early play was possible, because when buyer are proven wrong on the opening bar, there will be selling. It came quick. But often the stock grinds back in the morning, but then sells off for the rest of the day. That 10:30 high marked the high for the rest of the day, and very strategic entries were available — entries that are high odds with great risk to reward.

Putting all of this together, trading morning gaps is not hard, but it is very counter intuitive for many new, or even somewhat experienced traders. Very simply stated, trading the proper, quality morning gaps is one of the few times you truly have an edge. If you are sick of hit or miss concepts, ask yourself what ‘edge’ do you currently have in your current trading strategies. Trading professional gaps has you trading on the side of big money. This means big moves. This means fast moves. This means that once you know the entries, stop outs are fewer than with most trading strategies.

Thank you for reading this article. If you are serious about trading then feel free to reach out to us. I teach and trade only one method on gaps which I alone created. My method sets up fast and the trades move with momentum quickly, so you can trade and get on with your day. I only trade the first half hour of the market day. It is easy to follow my trades as I call them live while I'm taking them and only trade one stock at a time, and usually one stock only per day. There is no chitter-chatter in the room, it is just trading and teaching. If you want to make money and are focused on doing so then The Stock Swoosh can help teach you how. At the Stock Swoosh we have one focus during one time frame in order capitalize on trading the first 30 minutes of each day with a focus on shorting stocks that meet certain criteria.

SPECIAL OFFER - EMAIL MELISSA

We are offering exclusively to you, as a reader of this eBook, a special offer if you sign up for our Golden Gap Course.

Contact [email protected] for details.

Also if you want a trial to The Stock Swoosh Show Live Trading Room, email [email protected] with 'Free Trial Request' in the title.

If you have any other questions or are interested in our course please contact us at [email protected] or call 929-3200-GAP.

ABOUT THE AUTHOR

Author: Melissa Armo, Founder
Company: The Stock Swoosh
Website: TheStockSwoosh.com
Services Offered: Trading Rooms, Trading Courses, Newsletters
Markets Covered: Stocks, Options

Melissa developed a system that capitalizes on the big moves that happen near the open of the market every day. She has built an international business that informs her clients how to trade successfully utilizing her system.

Chapter
12

Using a Multi-Bucket Approach as a Wealth Building Strategy

By Serge Berger, TheSteadyTrader.com

Linearity in the stock market is a myth, i.e linear returns are rarely if ever possible over time regardless of what people claim. What is possible and very realistic is what I refer to as a multi-bucket approach that allows investors to combine a wealth-building strategy with an income strategy.

Are you looking for some supplemental income from the markets while at the same time remaining your longer-term exposure the stock market? People at any stage in life can appreciate some extra income, particularly in or around retirement.  

In this video I will explain a strategy that focuses on wealth building and income generation at the same time.

While wealth in the stock market is built over time through smart asset allocation, income generation from one's portfolio for many is less understood. By combining and properly executing two of the highest probability strategies there are, i.e. trend following and options spreads selling, any investor and trader can achieve this lucrative balance of capital appreciation and income generation. 

THE MOVIE: USING A MULTI-BUCKET APPROACH AS A WEALTH BUILDING STRATEGY


THE SPECIAL OFFER

The Ultimate Candlestick Bootcamp, plus the B2 Reversal Indicator and Scanner

The ultimate candlestick bootcamp (UCB) is an 11 part video-series trading course and 30 page e-book that will teach you Serge’s high probability trading and active investing strategies which he has learned and perfected over his nearly twenty years as a trader. These are some of the same powerful trading methods that professional traders such as banks, prop firms, and hedge funds use around the world in their daily trading activities.

The B2 Reversal Indicator is a powerful trading and investing indicator that works in any time frame and any asset class. High probability buy and sell signals represented by easy-to-read up and down arrows flash on the charts.

ABOUT THE AUTHOR

Author: Serge Berger, Head Trader and Investment Strategist
Company: The Steady Trader
Website: TheSteadyTrader.com
Services Offered: Trading Education, Trade Alerts, Trading Workshops
Markets Covered: Stocks, Options, Futures

Over the years, Serge has created a trading methodology that divides markets into different time-frames and characters, allowing him to more clearly and without emotions determine which strategies to apply in which situations.

Chapter
13

9 FOREX “LIFE HACKS” TO MAKE YOU A BETTER TRADER

By Joshua Martinez, MarketTraders.com

INTRODUCTION

Some of the most popular social media posts are the so-called “Life Hacks”.  These fun little strategies take the worry out of doing everyday chores and generally make life easier.

Just like you can use life hacks to make life easier, you can use strategies to make trading the Forex easier.

By sticking with these Forex Life Hacks, you increase your chances of Forex success:

Forex Life Hack 1: Memorize the Top Candlestick Formations

Every trader knows to watch the candlesticks, but how many know candlesticks enough to see their recurring patterns?  Few traders realize that candlesticks do more than show what the market is doing in that time frame, they also come together to create formations that expert traders can spot and use for profits.

There are a wide variety of candlesticks, and a lot of them have some pretty unique names, but there are a few that are important to remember:

Some candlestick formations to take note of are the Bullish Tweezer Bottom, the Bullish Piercing Line, the Bearish Engulfing Candle and the Bearish Shooting Star.  Each of these names gives an indication of the market direction and makes some connection between the candlestick and its wick.

Spotting these formations early allows you to get into the market right before a major move occurs, thus increasing your profit potential and allowing you to strike while the iron is hot.

Forex Life Hack 2: Stick to 2 or 3 Strategies...Max.

A phrase we like to use is “simplicity leads to pips”. When you come at the market with 20 different strategies, you end up stretching yourself too thin and you miss out on profits because you’re trying too hard. That’s why it’s important to limit the strategies you use to two or three at a max.

Why three?  It’s not because it’s a handy number, or one that translates easily.  It’s because there are three types of market movements, and it helps to have a strategy for each. You need a strategy for when you day trade, a strategy for when you are in a swing and/or a position trade, and one strategy for sideways movement.

Having three trusted strategies for each of these market conditions means that you should be more prepared to quickly review the market, whether the market is making for quick day trading movements, or is experiencing consolidation that spans ten or more days. You have something to analyze the conditions against, and the strategies to help you take advantage of these moves.

Forex Life Hack 3: Use Multiple Time Frames to Trade

The number one question new traders ask is what time frame they should trade within. The answer to this varies, but the bottom line is You should always be trading on more than one time frame!

How can this work?  It’s simple, time frames don’t work in a vacuum.  Each one has an effect on the other, and patterns that appear in long-term trades make appearances in short-term trades...and vice versa.

For example, if you’re looking to enter on the one-hour chart, you want to begin your analysis on at least the 4-hour chart or any larger time frame’s chart.

The rule is to always have your secondary, larger time frame be at least four times the size of your initial time frame.

Think of timeframes of having a parent-child relationship to each other.  The larger timeframes will have an effect on the smaller ones, much like parents have an effect on their children. The larger timeframe sets the scene for the smaller timeframes. Once you’ve established the overall direction of the market by the larger timeframes, you can trade the smaller timeframes for the specific entry and exit points.

A monthly time frame typically shows the next A-B-C-D formation for only the next 2,000 pips-worth of movement. The daily time frame shows the corresponding movements that create the larger A-B-C-D formation for the next 500 to 1,000 pips worth of market action.

The great thing about this method is that it solves the largest problem that faces many currency traders. That problem is knowing when to stop buying and when to start selling.

With the larger movement identified, traders can better determine when the market’s tides are preparing to change for a full movement in the other direction, as opposed to the natural wave-like movements that make up large market swings.

Forex Life Hack 4: Never Risk More than 2 - 5% of Your Account

A good piece of advice in life is to never risk more than you’re willing to lose. Whether you’re trading in the stock market or taking a mortgage out on your house, you should never put up more than you can live without. This is especially true when the thing you’re risking is money.

It’s worth mentioning again: You should NEVER risk more than you’re willing to lose.

The Ultimate Traders Package on Demand™ suggests never risking more than five percent of your account.

You have to understand, before going into the market, that every trade you might do comes with it some risk. There isn’t a trader in history that has a 100% winning percentage.  The fact of the matter is that you will lose at some point, but  when you manage your risk successfully you can take those losses and live to fight another day.

You also want to be able to put in enough money to make a profit.  After over 20 years of experience, we have figured out that the sweet spot between making money, and not going bankrupt when losing money, falls in the two to five percent range.

We recommend beginner or more risk-averse traders to start with risking only two percent of your current trading pool in every trade.  Once you become more experienced in the market, or your profits have risen enough, you can move to three, four, or the full five percent.

Forex Life Hack 5: Identifying and Trading the King’s Crown

One of the more famous, and often used, strategies is something called the Head and Shoulders pattern.  This happens when a bullish trending market makes a peak and begins to retract. The name comes from the picture the market makes as it peaks and valleys. The highest point is the head, and the two lows on either side of it are the shoulders.  In theory, you draw a “neckline” connecting the two shoulders and begin to trade at that point.

The problem is, the market will often overcorrect itself and you’ve taken a loss before you knew what hit you.  That’s why the FX Chief™  prefers to trade a different pattern: The King’s Crown.

The King’s Crown is trading beyond the “shoulders” of the Head and Shoulders pattern. Once the market takes out a low of support, it has a tendency to bounce back up and wave before the market finally falls. In this strategy, your stop would be taken out on that rally right before the market turned to complete your direction.

Basically, you aren’t trading the neckline, you are trading the breaking point beyond the lowest low. This extra spike in the market (turning the person in a crown) allows you to see the true indication of the markets and could lessen the chance you have of taking on losses in the future.

Forex Life Hack 6: Learn to Love the Stochastic RSI

Think of the ups and downs of the market as trends like in the fashion industry. Take leg warmers for instance.

Back in the 80s leg warmers were very popular, they were used by a large segment of the population, and then once it hit a certain point it became TOO popular and there was a backlash created against it, making the trend slowly go away.

A lot of fashion manufacturers would have loved to have known when the trend was starting to go away. They would have wished they knew some kind of indicator.

There might not be an indicator like that for the fashion industry, but there is for the markets. It’s called the stochastic RSI, and it could be your key to trading.

The stochastic RSI is made up of two lines that serve as a sort of benchmark for when the market is looking to reverse.  If the stock is traded too high, it will break that line and begin to trend down. If the stock is going too low, it will break the bottom line and start trending back up.

Having a handle on the two barriers that the stochastic line makes up will give you a sense as to when you should reverse your direction and go from bull to bear, and vice versa.

Forex Life Hack 7: Utilize Stop-Losses for Your Wins

How familiar does this sound?

You put in to the market and, like a good trader, you set your stop.  However, you find yourself constantly being taken out just before your big win.  It’s a common problem that has one easy solution

You need to change your stop-losses as the market changes!

As the market fluctuates, the stop losses grow larger in size. This volatility creates higher highs and higher lows, which can spell higher profits for smart traders.

And smart traders adjust their stop losses to mirror the market.

Traders make stop losses to prevent themselves from losing their entire account over the course of one trade.  By setting a minimum number for the market to hit, once the market hits that number, the trade is automatically ended and the loss is taken. The way to properly use a fluid stop-loss number is to move the minimum number in accordance with the market moves.

Let’s look at an example.

The chart below has several yellow circles. These circles represent the stop-loss price at different times in the trading timeframe.  Starting from the furthest left circle, you would adjust your stop-loss to match the next lowest number the market hits (which is the new yellow circle).

Even without the benefit of seeing the actual numbers, you can see the difference between the furthest left and the furthest right circle. This pip difference would be lost if you didn’t utilize a moving stop-loss number.

How do you know when to move your stop-loss?

It’s easy.  Look for a high or a low that has two candlesticks to the left, and two candlesticks to the right that are either higher or lower from that point.  A high will have two lows to the left and right, a low will have two highs to the left and right.

Forex Life Hack 8: Using Reversals to Your Advantage

Trading occurs in a 24-hour window consisting of three different trading sessions: European, U.S. and Asian sessions.  The European session has the most movement, followed by the U.S. and then the Asian markets. More often than not, the market will reverse directions when one session ends and the other begins. It’s by playing off this reversal that the most pips are captured.

It stands to reason that if the European session is trending bullish that once the American session kicks in, it will set up a reversal and the market will turn into a bear.

By utilizing this strategy you can pinpoint the reversal points, take advantage of the market movement, and identify when a market high and low will occur. With three trading sessions happening per day, there is the potential for 2 reversal points per day, which means that using only one strategy can dictate how you look at three different markets.

Forex Life Hack 9: Pinning Your Trading Personality

There are four distinct types of trading personalities.  Finding yours could be the key to trading your strengths and limiting your weaknesses. It’s rare for a new trader to know their personality, so read the explanations and see if there is one (or multiple) that describes you.

The Now Trader: The now trader wants to get in, get their pips, and get out.  They generally use smaller time-frames, spend less time per-day trading and capture smaller pip numbers. However, because they trade in such short timeframes, the Now Trader tends to trade more often and have more straightforward trading strategies.

The In-The-Game Trader: These traders love to check into the market daily, but prefer their action to be longer-lasting and tend to favor larger pip captures over a longer period of time. The daily trader often trades in the more mid-range timeframes and pays close attention to reversals and predictive fibs.

The Adrenaline Junkie Trader: These traders only trade once, or a couple times, per month based on major announcements such as quarterly or earnings reports.  They love the riskiness of the market and tend to trade for only a couple hours at a time, but they end up winning big if their strategies hold true.

The Low-Maintenance Trader: The ultimate set-it-and-forget-it trader.  They like to trade in the long-term by utilizing strategies that end up with big profits over many months.  They aren’t looking for the thrill of the high-risk maneuver, or the commitment of a daily trading schedule.  Rather, they are banking on safer picks that will benefit them in the future.

There is no right or wrong way of trading, there is potential to make money in all of them.  What matters as a trader isn’t when, or how often, you trade.  The key to successful trading is managing your risk, developing your strategy, and making smart decisions based on the charts.

SUMMARY

Like any Forex tip, these can’t guarantee a win, and trading the Forex has an inherent risk involved.  However, these tips can provide some insight into the mindset of those who have successfully traded in the past.

Using the tips seen here along with sound risk management, having a secondary source of income is possible by trading the Foreign Exchange.

THE SPECIAL OFFER

Unlock the #1 trading tool to detect trade setups with a winning percentage over 84.6%

ABOUT THE AUTHOR

Author: Joshua Martinez
Company: Market Traders Institute
Website: www.MarketTraders.com
Services Offered: Trading Education, Live Learning Opportunities, Video Courses, Live Trading Room
Markets Covered: Forex, Options

Josh has made a name for himself with the London Daybreak strategy and trading feats such as doubling his trading account in a single month and earning $10,000 in 30 minutes with his personal trading strategies. As a course creator, mentor and active instructor with MTI, you can find Josh in MTI student classes, live training sessions and MTI's free workshop series that are open to the public.

Chapter
14

How to Automatically Boost your income and protect your nest egg at the same time

By Don Fishback, DonFishback.com

The Protection Challenge

Here is a challenge. I want you to think of “protection”. 

Protection comes in all sorts of different forms. If it’s your house, protection can be an alarm system, locks, smoke detectors, fire extinguishers, even safety glass. Protection also comes in the form of insurance, so that you’re covered if something bad does happen.

If it’s personal protection, it could be in the form of safety devices, like seatbelts and airbags in cars, or perhaps medicine and vaccines, first aid kits for the home. Personal protection also comes in the form of insurance, so that you’re covered if something bad does happen.

So here is the challenge...

As diverse as these varied forms of protection are, what is the one thing they al have in common besides providing protection?

If you answered, “they all cost money”, you’re right. Protection costs money.

That’s why it is a widely accepted fact that if you want protection, you’re going to have to pay.

But what about your investments?

As the previous examples illustrate, it comes as no surprise that for you to be protected, it’s going to cost you.

But what about your investments?

For most people, it would make perfect sense that it’s the same with investments; protecting your investments should cost money. In fact, it is a well-established assumption in economics that it costs money to add safety to an investment.

The more protection you want for your nest egg, the more it is going to cost you -- not necessarily in out of pocket dollars, but in lower returns. That’s why a CD or a T-bill pays a lower guaranteed return than a non-guaranteed return on less predictable investments.

But what if I told you -- in fact, what if I proved to you -- that it is truly possible to not only add a level of protection to your nest egg, but that you would actually get paid to do it?

In this video, I will show you not only how to protect your investments, but how to boost your income at the same time.

THE MOVIE: HOW TO BOOST INCOME AND PROTECT YOUR NEST EGG AT THE SAME TIME


THE SPECIAL OFFER

Get my "Options for Beginners" eBook Absolutely Free!

What you will Learn in this eBook:

  • How You can change the rules of investing
  • Profits can be unlimited
  • Risk can stay strictly limited
  • How to profit in Up, Down or Sideways Markets

The book is absolutely free. All we ask you to do is to make a small $14.99 donation directly to the American Heart Association.

ABOUT THE AUTHOR

Author: Don Fishback, Founder
Company: Fishback Management and Research, Inc.
Website: DonFishback.com
Services Offered: Trading Courses,Trading Software, Trading Recommendations
Markets Covered: Stocks, Options, Futures, Forex

Don Fishback started his own firm, Fishback Management & Research in 1993, to focus on volatility.  He has over 25 years of experience in the financial services industry.

Chapter
15

Hedging the Trump Rally

By Matt Buckley, TopGunOptions.com

E. Matthew ‘Whiz’ Buckley is the Chief Options Strategist for Top Gun Options LLC. He served as the Managing Director of Strategy at PEAK6 Investments in Chicago, the largest volatility arbitrage firm in the world. He was also the founder and CEO of the Options News Network, which provided retail options traders of all skill levels a behind the scenes look at the options market and world class options training. He’s also a former F/A-18 Navy fighter pilot who graduated from the Navy Fighter Weapons School (TOP GUN) and flew 44 combat sorties over Iraq.

In this video, Whiz covers a little-known TOP SECRET tactic that serves as a portfolio hedge and trade, a term he calls a ‘Tredge”. Mr. Buckley covers his proprietary Strategic/Operational/Tactical methodology and why he believes volatility is going to spike in the near term as the market rolls over. Record high markets, record low volatility, and unprecedented world and domestic events are a perfect setup for a bullish double vertical on VXX.

THE MOVIE: HEDGING THE TRUMP RALLY

THE SPECIAL OFFER

To take a 2-week test flight and check out the 4 portfolios Whiz manages from Weekly Options to Accelerated Retirement follow this link.

Click Here for a 2-Week Test Flight!

Whiz produces a daily market SITREP (situation report) which covers his take on the markets and world events along with potential actionable trades.

ABOUT THE AUTHOR

Author: Matthew “Whiz” Buckley, Founder
Company: Top Gun Options
Website: TopGunOptions.com
Services Offered: Trading Courses, Mentorship, Trade Alerts
Markets Covered: Stocks, Options

Whiz is a highly experienced financial business executive, and decorated Naval Aviator who graduated from Naval Fighter Weapons School (“TOPGUN”).

Chapter
16

THE FAST BALL EXPANSION OF RANGE AND VOLUME (XRV) SETUP

By Dr. Adrian Manz, TraderInsight.com

Big market moves spell big opportunity for traders.  The best trading setups that I have found over the past twenty years come when the expansion-of-range-and-volume (XRV) pattern that I call Fast Ball propels a stock rapidly higher or lower.  Fast Ball XRV moves occur when institutions have directed their traders to buy or liquidate large equity positions.  The stock in trade overwhelms supply or demand, pushing price in a rapid directional move higher (in the case of buying), or lower (in the case of selling).  The resulting chart pattern is easy to spot and provides traders the opportunity to capitalize on institutional activity, which tends to continue over the course of several trading sessions.

Identifying Fast Ball Expansion-of-Range-and-Volume (XRV) Setups

The ability to zero in on institutional activity has made the Fast Ball XRV the cornerstone of my trading business for 20 years.  It is easy to find on daily price charts and intraday price support and resistance zones make risk control very intuitive.  Stop losses are placed outside of clearly-identifiable setup-day 5-minute intraday support or resistance.  The targets are also easy to spot, and are most frequently placed at daily resistance (for long trades), or support (for shorts).  There are two types of Fast Ball XRV chart pattern and the Type 1 setup is discussed first.

Fast Ball XRV Pattern Type One

The first Fast Ball XRV chart pattern occurs when a trending move pulls back, then breaks out in the direction of the trend.

The rules for a long entry are as follows:

  1. A stock is trending higher and pulls back.
  2. A breakout of the pullback occurs on the widest range of the past ten sessions, preferably on heavy volume.
  3. The buy entry is the following session, $0.10 above the XRV bar in the direction of the breakout.
  4. Close out at the end of day, or at the overhead daily resistance target, or on a trigger of a protective stop.

The rules for a short sale are as follows:

  1. A stock that is trending lower pulls back.
  2. A breakout of the pullback occurs on the widest range of the past ten sessions, preferably on heavy volume.
  3. The short-sale entry is the following session, $0.10 below the XRV bar in the direction of the breakout.
  4. Close out at the end of day, or at the underlying daily support target, or on a trigger of a protective stop.

An example of a short-sale setup is provided in a recent move in Welltower Inc (HCN), in Figure 1.

Based on the price movement in Figure 1, the parameters of the trading plan for HCN for July 7, 2017 were as follows:

  1. A pullback and breakout occurred on the widest range of the past ten sessions, on heavy volume.
  2. The short sale is 0.10 below the low of the XRV bar (short at $792)
  3. The stop loss price is 0.05 above 5-minute intraday overhead resistance (stop out at $724).
  4. The profit target is at the daily support inflection (buy-to-cover at $72.41)
  5. Once the trade is initiated, money-management rules take over, and the position practically manages itself.

There are three hurdles that HCN must achieve to exit without a loss.  The first is that HCN must trade lower to within 50% of the distance from the entry to the profit target.  At that point, the stop loss is moved to breakeven.  The second is that HCN must trade to within 0.10 of the profit target.  At this point, the stop is moved down to the 50% to target level.  The final hurdle is the profit target.  When HCN hits the target, all shares may be closed, or a portion may be closed, with a trailing stop placed on the balance to protect the open profit.  For accounting purposes, we record all shares as being closed at the target when it is reached.  We will exit the trade immediately if the stop loss is hit.

As represented in Figure 2, the intraday trade in HCN hit the 50%-to-target level within minutes of the trade being initiated, moving the stop to breakeven.  When 0.10-to target was achieved, the stop was moved to $72.67, which is 50% of the move to the profit target.  This locked in a profit and created a risk-free position.  When the target was hit at $72.41, the position was closed.  The profit was 0.51 per share traded.

XRV Pattern Type Two

The second Fast Ball XRV chart pattern is also easy to spot, and occurs when a trending move pauses and forms a consolidation range.  This time, we are looking for a trend or counter-trend breakout of the consolidation range.

The rules for a type 2 long entry are as follows:

  1. A stock that is trending higher consolidates for several days.
  2. A breakout of the consolidation occurs on the widest range of the previous ten sessions, preferably on heavy volume.
  3. The buy entry is the following session, $0.10 above the extreme of the XRV bar in the direction of the breakout.
  4. Close out at the end of day, or at the overhead daily resistance target, or on a trigger of a protective stop.

The rules for a short sale are as follows:

  1. A stock that is trending lower consolidates for several days.
  2. A breakout of the trend pullback occurs on the widest range of the previous ten sessions, preferably on heavy volume.
  3. The short-sale entry is the following session, $0.10 below the extreme of the XRV bar in the direction of the breakout.
  4. Close out at the end of day or at the underlying daily support, or on a trigger of a protective stop.

Figure 3 provides an example.  The components for a potential long entry in VF Corp (VFC) were in place.  The parameters for the upcoming session were:

  1. The entry is 0.10 above the high of the Fast Ball XRV bar (buy at $55.46)
  2. The stop loss is 0.05 below 5-minute intraday support from the trading that occurred in the Fast Ball XRV setup day (stop out for a loss at $55.06)
  3. The profit target is at the inflection at daily resistance (sell for a profit at $56.25)

Figure 4 shows the intraday 5-minute chart and the progression of the VFC trade once it triggered.  Note that Fast Ball XRV trades are frequently accompanied by rapid intraday moves, as buying or selling pressure reassert during trading.  This is particularly true during the first few minutes of the session and is caused by the flood of directionally biased orders that were staged prior to the market open.  These orders can result in extreme volatility because they are frequently placed as market-on-open orders.  They exhaust liquidity and push price rapidly in the direction of the Fat Ball XRV daily momentum.  Once these orders have been filled, price frequently reverts toward the prior session’s close to provide both shorter and longer time frame opportunities for profit.

Success of the “Textbook” Pattern

Held to the strictest interpretation of these guidelines the Fast Ball XRV has generated significant results in a $100,000 non-compounded trading account each year since 2006.  Trading a fixed lot size of 1,000 shares, the Fast Ball XRV generated an average annual return of $20,390 or 20.39 per cent.  Accounting for the fact that a $100,000 account could generally leverage more than 1,000 shares per trade, this return could easily be increased substantially by assuming additional risk on each position.

The most significant characteristic of the Fast Ball XRV is the stability of the pattern over time, and the fact that it tends to outperform on the short side of the market.  Short sales produce more profitability even when the broader markets are making large positive swing moves as they did in 2013, 2014, 2016 and 2017.  These returns are not curve fit or back tested, but rather are the results for the Fast Ball XRV triggers as they were planned and published in my trading plan at traderinsight.com since 2006.  Each trade is rule-based and handled by strict money management criteria to maximize replicability.  A copy of the rules and every Fast Ball XRV setup since 2006 is available at www.TraderInsight.com.

Layering in Multiple Entry Points to Increase Profit Potential

The textbook version of the Fast Ball XRV generates great results.  But there is always room for additional opportunity and in recent years I have used alternate entry levels based on multiple-session support, resistance, Fibonacci retracements, and floor trader pivots to generate additional opportunities for profit.  Figure 5 shows a trading plan in Southwest Airlines (LUV) that never triggered by its original trading parameters, but booked a profit on the session with alternate entry parameters.

As you can see in figure 6, the support and resistance alternate-entry data presented in my trading plan in Figure 5 show an inflection confluence entry at 62.31.  When this entry triggered, the initial target at prior-session-support (61.92) created a profit of 0.39 per share traded in LUV. 

The secondary trades are simple support and resistance alternate entries.  Their ability to generate significant profits has, however, been substantial.  Students of my work become believers when they take the time to refine their plans and develop multiple entry levels for the Fast Ball XRV.

Putting the Pieces Together

The Fast Ball XRV is one of my favorite trading setups.  It has served up trading opportunities in all types of markets over the past 20 years, and the options for alternate entries are plentiful because of the range and volatility on the setup day.  Though I scan over 1,400 stocks by hand each night to identify the XRV and my other patterns, several scanners are available and have been customized so my students can identify and narrow the next day’s possibilities with ease. These students are then trained how to setup the XRV trades, allowing them the autonomy and self-direction they seek in their trading.

THE SPECIAL OFFER

Readers who are interested in learning more about the strategy can watch a one-hour seminar I presented recently.

ABOUT THE AUTHOR

Author: Adrian Manz, Founder & Lead Day Trader
Company: Trader Insight
Website: TraderInsight.com
Services Offered: Trading Rooms, Trading Courses, Special Events
Markets Covered: Stocks, Options, Futures

Dr. Adrian Manz is one of the most sought-after market educators, and is a popular speaker at international conferences, in the print media, and on radio and television.

Chapter
17

THE IMPORTANCE OF DIVERSIFICATION

By Ayoub Ben Rejeb, ElliottWave-Forecast.com

“Don’t put all your eggs in one basket”

This is one of the most familiar and simplest quotes to explain diversification. The idea behind it is simple: If the basket falls, not all your eggs will be destroyed at once since they are spread out in different baskets.

While that belief certainly captures the essence of the issue, it provides little guidance on the implications of the role diversification plays in an investor's portfolio and offers no insight into how a diversified portfolio is actually created. In this chapter, we'll explain diversification and give you some insight into how you can make it work to your advantage.

What Is Diversification?

Diversification is a risk management technique that mixes a wide variety of investments within a portfolio. The theory behind this technique state that a portfolio constructed of various kinds of investments will, on average, yield higher returns and present a lower risk than any individual investment found within the portfolio because the positive performance of some investments neutralizes the negative performance of others. Therefore, the benefits of diversification hold only if the instruments in the portfolio are not perfectly correlated.

Money managers and investment professionals know the benefit of diversification which is why it's an essential component of any retirement savings plan. No one questions the logic of diversifying investments when it comes to a retirement plan. Everyone knows that diversification lowers risk, and if done right, the good investments will outweigh the bad ones.

Taking a closer look at the concept of diversification, the idea is to create a portfolio that includes multiple instruments to reduce risk. Consider, for example, an investment that consists of only one stock issued by a single company. If that company's stock suffers a serious downturn, your portfolio will take the full brunt of the decline. By splitting your investment between the stocks from two different companies, you can reduce the potential risk to your portfolio.

Why You Should Diversify

The goal of diversification is not necessarily to boost performance, it won’t ensure gains or guarantee against losses. But once you choose to target a level of risk based on your goals, time horizon, and tolerance for volatility, diversification may provide the potential to improve returns for that level of risk and it can help an investor manage risk and reduce the volatility of an asset's price movements. Remember though, that no matter how diversified your portfolio is, risk can never be eliminated completely.

You can reduce risk associated with world indexes or individual stocks but general market risks affect nearly every instrument as we believe that there is one market and everything is correlated in multiple degrees, so it is also important to diversify among different asset classes. The key is to find a medium between risk and return; this ensures that you achieve your financial goals while still getting a good night's rest.

Building a Diversified Portfolio

Modern portfolio Theorists and Trend Following Wizards, usually emphasize this concept and are often quoted as trading around 100 different types of instrument, if not more. But diversification isn't only based on having multiple instrument and can be done through other methods.

With so many investments to choose from, it may seem like diversification is an easy objective to achieve, but that sentiment is only partially true.

To start building a diversified portfolio, you need to make sure your asset mix is aligned to your investment time frame, financial needs, and comfort with volatility. Then you should look for assets (stocks, commodities, bonds, cash, or others) whose returns haven’t historically moved in the same direction, and to the same degree, and, ideally, assets whose returns typically move in opposite directions. This way, even if a portion of your portfolio is declining, the rest of your portfolio, hopefully, is growing. Thus, you can potentially offset some of the impact of a poorly performing asset class on your overall portfolio.

Another important aspect of building a well-diversified portfolio is that you try to stay diversified within each type of investment.

Taking the case of trading stocks, within an individual stock holdings, beware of over-assemblation in a single stock. For example, you may not want one stock to make up more than 2% of your portfolio. We also believe it’s smart to diversify across stocks by market capitalization (small, mid, and large caps), sectors, and geography. Again, not all caps, sectors, and regions have prospered at the same time, or to the same degree, so you may be able to reduce portfolio risk by spreading your assets across different parts of the stock market. You may want to consider a mix of styles, too, such as growth and value.

Inside every asset class, there are further categories that you can choose from. Take for example, Gold. You can buy physical gold or you can invest in Gold Schemes of Banks or you can also buy a Gold Fund that invests in gold mining companies or you can directly trade the spot of Gold "xau" against any currency and then of course you can buy an Exchange traded fund or a Gold ETF.

In equity, you can look at various sectors and the specific stocks within those sectors. A good example could be to invest in defensive sectors (those that do well even in an economic downturn) like consumer goods or healthcare and then going one step further, you would want to commit your money to the largest public-sector bank or the consumer goods company that has started showing a high growth in its sales.

Similarly, when it comes to your bond investments, consider varying maturities, credit qualities and durations, which measure sensitivity to interest-rate changes. Generally, the bond and equity markets move in opposite directions, so, if your portfolio is diversified across both areas, unpleasant movements in one will be offset by positive results in another that's why a combination of asset classes will reduce your portfolio's sensitivity to market swings.

Let's say you have a portfolio of only airline stocks. If it's publicly announced that airline pilots are going on an indefinite strike and that all flights are canceled, share prices of airline stocks will drop. Your portfolio will experience a noticeable drop in value. However, if you counter-balanced the airline industry stocks with a couple of railway stocks, only part of your portfolio would be affected. In fact, there is a good chance that the railway stock prices would climb, as passengers turn to trains as an alternative form of transportation.

But, you could also diversify even further because there are many risks that affect both rail and air because each is involved in transportation. An event that reduces any form of travel hurts both types of companies - statisticians would say that rail and air stocks have a strong correlation. Therefore, to achieve superior diversification, you would want to diversify across the board, not only different types of companies but also different types of industries. The more uncorrelated your stocks are, the better.

Further diversification benefits can be gained by investing in foreign securities because they tend to be less closely correlated with domestic investments. For example, an economic downturn in the U.S. economy may not affect Germany's economy in the same way; therefore, having German investments gives an investor a small cushion of protection against losses due to an American economic downturn.

Looking at another example of a stock portfolio, which includes Apple, Facebook, Amazon, Microsoft, Google (now Alphabet), Tesla and a bond for “safety”. If the holder has asked, “Am I diversified?” the answer would have been a resounding “No!” As many of you know, most of these companies are related to technology and the only play here is the hope for this sector to keep going up forever! One quick reversal and months of gains will be wiped out. Obviously, in a six-stock portfolio, having 5 of them directly related to internet industry is not diversified.

Diversification for Day Traders

Diversification in the world of investing is the synonym of “safe” or “secure”, yet despite of the advantages diversification brings to trading, it is a relatively foreign concept to day traders.

There are three types of diversification commonly used for day trading or swing trading. This is not a complex process, by diversification you are simply having multiple trades on the same time and for different reasons. We will use the Forex market for these examples, as it is a 24-hour market, and the margin requirements are not increased for holding positions overnight (as with futures and stocks which may make applying these methods more difficult).

Forex Pair Diversification

Instead of always just trading one pair we will look for trade setups in multiple pairs. Whether day trading or swing trading this often means having multiple positions going on at the same time. And there is an advantage to this. Let's assume that your average win ratio on your strategy is 60%, meaning for every 100 trades you will win 60 of them, on average. By just taking one trade, you do have a slight edge and you're expected to win that trade about 60% of the time, but with just one trade really anything can happen as you could easily lose on it.

But the more trades you take the more you'll see the 60% win-rate advantage. Think of a casino, they could easily lose 1 hand of a blackjack, but over the course of a week and thousands of hands they rarely lose. I'm not suggesting that you over-trade, which is when you just trade to trade, with no strategy in mind. I am talking about taking more opportunities using a well-defined strategy. This typically means looking at multiple Forex pairs for trading setups.

While some Forex pairs are highly correlated, most are not. You can take multiple positions in different Forex pairs and they are all doing to move slightly differently. Assuming you have a decent strategy with at least 1/2 as a risk / reward and if your strategy does win more than it loses, then if you take 10 positions, you may lose on 4 or 3, but you’ll make money on the other 6 or 7 positions. But even if you end up losing 6 positions and only winning 4 of them you will end up on the winning side as your reward was double your risk.

Let's take an example and see what happens when a trader is long the EURUSD, long the GBPUSD, short the USDJPY and short the USD/CHF?

What this trader has done is actually going short the US Dollar in every position! (If you are brand new to Forex trading, all of the trades are done in currency pairs. When you go long the EURUSD pair, you are basically buying the EURO currency while at the same time selling the US Dollar currency. If you go short the USDJPY pair, then you sell the US Dollar currency and buy the Japanese Yen currency.)

Using this type of diversification is only increasing your risk for the main traded currency (US Dollar) and it will result either in a bigger loss / gain, unless there is a specific event that makes one pair do a separated move like the case for USDCHF in 2015 when SNB (Swiss Central Bank) unpegged the franc causing a spike in CHF pairs.

Perhaps this trader could be short the EURUSD, short the EURNZD, long the AUDCAD and long the GBPJPY. This way, no more than two positions are taken on the same currency at one time and both positions are on the same side (long or short) of the individual currency.

Strategy Diversification

Since most pairs are going to move differently than one another, the price action in them will be different based on volatility and they will have different structures which means different trade set-ups.

Using the same strategy all the time is good. Yet having two or three strategies can help out with stabilizing your profits over time.

Over the years I have tested and developed many strategies, yet most of them have at least one weakness, which means in certain market conditions it will not perform as well as other strategies. By utilizing three strategies at the same time, the strengths of certain strategies help offset the weaknesses in others.

Let's assume you initiate three trades using the same strategy which does not do well in volatile conditions, and on this day an unexpected event rocks the markets so you lose on my three trades.

Now assume you had used three different strategies, the one above, one which does very well in volatility and other which fairs ok. Now instead of losing three trades you potentially make money on one or two.

So consequently, you should prepare yourself for different market conditions either by having more than one strategy or by adapting your main strategy to new changes. You don’t have to use multiple methods to be successful. Many day and swing traders make a living trading one strategy, in one Forex pair on one time frame. These methods are just alternatives to consider.

Timeframe Diversification

To be able to diversify using timeframe, you'll need to combine the strategy and Forex pair diversification and then adds the time element. Look for trade set-ups on different time frames, you may typically trade off a 5 minutes chart, but there are also trades based on a 15 minute, hourly and daily charts, etc. The bigger the time frame the better the set-up as it will have lesser oscillation which means lesser possibilities.

As discussed above, assuming you have a winning a strategy, all these trades help give you an edge each day. One day you may be having a losing day trading, but a couple of your swing trades come in resulting in a profit for the day. It may work out that the swing trades lose as well, resulting in a bad day, but the odds of winning are greater than they are for losing. Assuming a greater than 60% win-rate on your trades, any high quality that you add is likely to produce more winning days.

Modern Diversification

We at ElliottWave-Forecast.com are implementing a more advanced way of diversification because market conditions have changed during the recent years and we believe that forecasting is a process of continuous adjustments. We are living in the era of electronic trading where machines have taking over humans by automatically generating signals and executing trades. Consequently, we think that every trader needs to focus on the technical aspect of the market rather than trading based on fundamental news.

Combining different type of diversification is the best way to trade in the modern world, that's why we only use Elliott Wave Theory as a language to help us read the market but that is not enough as an analyst / trader needs to add tools to help him decide when the idea is right or wrong. So, based on this we build our own strategy to forecast the market using Elliott wave, market correlation, time cycles, sequence of swings using our own proprietary distribution and pivot system.

We like to concentrate on the right side of market following the main trend starting from the higher time frame chart and we only want to take high probability trades based on our solid system with high accuracy which will act as a great trading tool.

The main idea is to focus on the trending instrument which have the clearest structure providing a tradable bullish / bearish sequence. So according to that concept we've been calling the world indices higher since 2010 and only looking to buy the pullbacks using the corrective 3, 7 or 11 swing sequence.

Once you have established long-term trades then you can look to diversify your portfolio by taking other swing trades in stocks or commodities and you can use Forex to trade the shorter-term cycles.

There is a positive side effect to doing this. You will realize that you can’t predict which trades are going to win and which ones are going to lose or break-even. Therefore, you won’t get attached to any single trade because you'll start to see the market as simply numbers and not about being right or wrong. This type of understanding is crucial to trading longevity.

CONCLUSION:

Diversification is considered as one of the main keys to great performance by using different trading strategies and instruments in order to have a higher chance of survival. However, diversification must be done correctly because when it is not done adequately it can have an opposite effect and compound instead of diminish risk.

Regardless of your means or method, keep in mind that there is no general diversification model that will meet the needs of every investor. Your personal time horizon, risk tolerance, investment goals, financial means and level of investment experience will play a large role in dictating your investment mixture. Start by figuring out the mix of stocks, commodities and cash that will be required to meet your needs. From there, determine exactly which investments to use in completing the mix, substituting traditional instruments for alternatives as needed. If you are too overwhelmed by the choices or simply prefer to delegate, there are plenty of professional's financial services available to assist you.

THE SPECIAL OFFER

Stay ahead of the market and Improve your trading performance by getting access to our 52 instruments updated in 4 different time frames, 2 Live Market Sessions done by our Expert Analysts every day, and our Live Trading Room with daily setups and 24-hour chat room support.

ABOUT THE AUTHOR

Author: Ayoub Ben Rejeb, Technical Analyst
Company: Elliott Wave Forecast
Website: ElliottWave-Forecast.com
Services Offered: Trading Education, Forecasting, Videos
Markets Covered: Stock Indices, Futures, Forex (50+ Instruments)

Ayoub Ben Rejeb is a Technical Analyst at ElliottWave-forecast.com which provides professional grade Elliott wave forecasts for different markets including Forex, Commodities, Indexes and stocks. Ayoub holds a Bachelor's degree in Mathematics and he has been actively trading for the last 6 years.

Chapter
18

SURVIVING THE IMPENDING CRASH WITH THE 2ND WAVE TRADE

By Scott Morris, PivotScalper.com

Over the past 10 years we’ve been inundated with new reports of an impending market crash. The funny thing about recessions and market crashes is that those who have a strategy to Survive and Thrive during such economic events usually make out like bandits.

So, what’s your strategy?

If you don’t have one, you better get one, and fast. I’m not trying to scare you, I’m just reminding you that if you don’t want to be on the wrong side of the next economic meltdown, you need to wake up and get busy.

There are plenty of ways to protect yourself but I’ve always found that understanding some basic market forces always gives me an edge. When the market crashes, it only hurts investors who are sitting on stocks waiting them to go up in value. For those of us who are “traders” we don’t care if the market goes up or down, we just care that the market is moving, and in all economic climates, the market moves, it breaths, it goes up and down, and that is all we need to protect ourselves and make money.

In this article, I’m going to introduce you to a simple strategy that I use every day. It is based on a Price Pattern that repeats itself constantly no matter what the general economy is doing and it will continue to repeat itself during a market crash.

So, this is one of many strategies or plans that you could adopt to protect yourself from the coming market crash. Let’s face it, the market MUST crash sooner or later, and with Donald Trump taking over the reins of our economy I am expecting a massive correction to the downside simply to bring reality back to the markets that Obama overinflated.

All politics aside, no matter who would be President our economy and $20 Trillion in debt is not sustainable. Level heads must prevail and allow the market to come back down to find equilibrium.

And that is where my 2nd Wave Trade comes in and this is a plan that you can implement right now.

Elephant Footprints

A friend of mine and one of the smartest traders in the world uses a brilliant metaphor when describing what happens in the markets and on your charts when they are being manipulated.

He says: “When Elephants walk across your lawn Scott, they leave footprints

And when Elephants, or in the case of trading, the “Monied Elite” or the “Market Makers”, the “Market Manipulators”, or “The Big Money” walk across or enter the market, they leave their foot prints all over your chart in the form of Price Patterns.

The 2nd Wave is such a Price Pattern, and all we have to do is learn to recognize the pattern and we can enter that trade every time it exposes itself and take our piece of the action.

I talk to traders almost every day who tell me they have been trading for 5 years or 15 years or even 25 years and they just can’t figure it out; they just can’t seem to get a break and win. I know exactly why they don't win or can’t win. Its because they don’t stick to a single strategy long enough to master it and usually they chose the wrong strategy or training to begin with.

Let me illustrate what I’m talking about.

If what I’m about to tell you is true, then every single trader in the world should be buying and using my 2nd Wave Trade. And, I have no doubt they would if they gave it a couple of weeks without getting distracted by the next shiny object or headline that comes along promising riches without so much as a mouse click.

But let me show you the 2nd Wave Price Pattern and you can decide if it has merit. This trade you can find on any chart in any timeframe and on any day of the week and in any instrument you chose.

So let’s look at the highlighted box first:

  1. You can see where it established a “Bottom”. We don’t know it’s a bottom when if first forms, we only know it’s a bottom after the price moves up, pivots again, and does not move down to the level of the previous bottom pivot.
  2. When the price moves up from the bottom we see a DoubleTail signified by the Yellow Doji and this is the beginning of our 2nd Wave Trade.
  3. The price now has to move at least 2 candlesticks in the opposite direction and form another DoubleTail before we know we have a second wave.
  4. Finally once the DoubleTail has formed we wait for a blue confirmation candle to form and we can enter the trade long.
  5. The conclusion of the trade happens upon the formation of the next DoubleTail.

The Second 2nd Wave Trade

Almost immediately after the conclusion of this trade, a top is formed and signifies the beginning of another 2nd Wave trade.

In this case the price action comes way down before it pivots to give us our second 2nd Wave trade on this chart good for over 40 ticks in the NQ.

Now let me show you several more charts where the exact same price pattern repeats itself and see if you can recognize the 2nd Wave.

Can you see the top in the chart below?

Can you see how the price action moves down, then pivots, then pivots again to begin the 2nd Wave Down?

Learn to recognize this Price Pattern and you will never work again in your life.

Now, let’s dissect the 2nd Wave Trade in minute detail:

Does this seem a little elementary to you? If so I can tell you that this could be another reason why you are not a winning trader. You can change all that by changing the way you think about trading and by who you follow.

Trading does not have to be difficult, and it is not difficult, but it is made difficult by many so called teachers and guru’s because by keeping it difficult it keeps them in business selling you expensive trading courses.

Well, I’m here to obliterate all that by showing you a simple Price Pattern that you can test on your chart without spending a penny. If you decide you could use my training or my DoubleTail to make recognizing these patterns easier, then I welcome your business, but you can do this all by yourself without anybodies help after you finish reading this report.

So let’s move on to my forensic dissection of a 2nd Wave Trade in images:

Image 1 shows the TOP, the Retracement, and the beginning of the 2nd Wave:

Image 2 shows the continuation of the 2nd Wave:

Image 3 shows the 2nd Wave continuing into profit and also shows that there is nothing for the trader to do until the next DoubleTail prints.

Now here is something that is worth the price of admission.

Every Reversal of priced happens on a DoubleTail, but not every DoubleTail signals a Reversal of price. So as long as you have red candles you have nothing to do but sit tight and let the trade execute:

Image 4 shows the conclusion of the 2nd Wave Trade signaled by the DoubleTail pivot at the very bottom:

The premise for this article is to convince novice traders that trading can be simple if you just allow it to be.

So many misconceptions are created by people who pretend to know something about a subject they actually know very little about or by people who believe something is complicated simply because they are unfamiliar with the subject.

We trade to make money, and the fastest way to learn how to make money trading is to MASTER a simple system like the 2nd Wave Trade and once you’ve mastered it never do any other trade as long as you live.

The 2nd Wave Trade will deliver to you as much money as you need to live any way and anywhere you want so why complicate your life trying to learn all sorts of other trading strategies that require months or years of learning?

Why?

It never made any sense to me.

Go back over my chart and my simple explanations of each one. Look on your chart every day and identify 2nd Wave trades and you will soon realize how simple it really is.

Compare the 2nd Wave Trade to any other trading system you’ve ever seen and see if it’s not the easiest to learn, the quickest to Master, and the surest way to make money trading.

Like I said, it works in any instrument, on any chart. The only thing I’ve done is create custom candlesticks to make the price patterns easier to recognize, that’s my claim to fame, but all I’ve done is enhance what is already there for all the world to see.

I encourage you to reevaluate your trading plan and your trading future. Take a serious look at what you are doing now and what you want to achieve with your trading.

If your trading goals are simple like mine, which is to make money every day in about an hour a day, then I hope you will Master the 2nd Wave Trade and toss everything else in the trash. Toss every other indicator you have in the trash because all they are doing is cluttering up your chart and distracting you from the Elephant Footprints that are there for anyone to see.

THE SPECIAL OFFER

If you’d like to know more about my 2nd Wave Trade you can visit http://PivotScalper.com or you can email me at [email protected] if you have questions.

I sure hope you got some value from the time you spent reading this short article. Everything you need to be successful making money trading is right here, so take the time to read it again and really give some serious thought to how you got where you now are in your trading and how you can get from where you are to where you want to be.

ABOUT THE AUTHOR

Author: Scott Morris, Founder
Company: Pivot Scalper
Website: PivotScalper.com
Services Offered: Trading Software Indicators
Markets Covered: Stock Indices, Futures (especially Crude Oil)

Through his website, Scott Morris set out to develop ultra simple trading methods that anyone can follow giving the regular guy and girl the opportunity to add significantly to their income while keeping their risk low.

Chapter
19

Mastering Momentum Gaps for Multi-Day Trend Potential

By Toni Hansen, ToniHansen.com

Would you like to learn the stock selection tactics that allow professionals to enter some of the strongest momentum players of the week right as those moves begin to unfold?

Traders who specialize in trading opening gaps gain instant access to the most volatile, and hence the most lucrative, stocks every day. Gap traders are not held hostage by the daily up and down movements of the overall market, nor by the whim of policy makers in Washington (although those whims can certainly increase potential gains!)

Better yet, trading momentum gaps requires virtually no overnight scanning. You can easily come in, trade the opening momentum, decide which selections have the greatest multi-day potential, and be done with your trading day in under two hours!

Why should YOU be interested in market gaps?

  • Maximum momentum gain in mere hours
  • High flexibility throughout the rest of your trading day
  • Specific traits lead one to focus upon only the strongest securities
  • Minimal scanning necessary
  • 1-3 trades per day with typical returns of 5-20 times risk and very limited losses

THE MOVIE: MASTERING MOMENTUM GAPS FOR MULTI-DAY TREND POTENTIAL


THE SPECIAL OFFER

Sound like just the knowledge you need? Check out the new class, “Mastering Momentum Gaps for Multi-Day Trend Potential,” by 20-year veteran online trader and trading mentor Toni Hansen and become a gap master as well!

ABOUT THE AUTHOR

Author:  Toni Hansen
Company:  Toni Hansen
Website:  ToniHansen.com
Services Offered:  Trading Courses, Bootcamps, Private Coaching
Markets Covered:  Futures, Stocks, Bonds, ETFs, and Forex

Toni is one of the most respected technical analysts and traders in the industry with a high reputation for accuracy in both bull and bear markets.