Charting Your Best Course - Setups Designed for Consistency

Charting Your Best Course: Setups Designed for Consistency is brought to you by The 8,000% ROI Play

A 100% FREE video from our sponsor, the Banyan Hill Research Team

GET THE FREE REPORT HERE

HOW TO GET THE MOST OUT OF THIS EBOOK

Thank you for accessing the eBook- Charting Your Best Course - Setups Designed for Consistency. This eBook is designed for beginning, intermediate and advanced traders and investors. The authors in this eBook are leading experts in evaluating opportunities in stocks, options, futures and Forex markets.

As you read this eBook and view the videos, you will be exposed to strategies and techniques that are designed to help you become more confident and consistent in your trading and investing activities. It is our sincere hope that after reading this eBook, you will take away a few actionable strategies that can help you achieve better trading consistency.

Many of the chapters in this eBook are divided into two sections:

“The Game Plan” – An introduction to a strategy and technique that may be enhanced with illustrations and examples.

“The Special Offer” – If you like the strategies and techniques being discussed, this is where you can get more information on the author and services they offer.

Some of the things you will learn in this eBook include:

At ExpireInTheMoney.com it is our sincere hope that you take away several ideas that you can use when you are done reading this eBook. You may also learn about markets that you currently don’t follow, and you will find out if they are suited to your trading and investing personality.

Finally, make sure to subscribe to ExpireInTheMoney.com.

We provide free eBooks, videos, reports and other publications for active traders. Cheers to your trading success!

Chapter
01

HOW THE INTERNET OF THINGS (IOT) IS FUELING HUGE INVESTMENT OPPORTUNITIES

By Staff Writer, ChartExperts.com

The Internet of Things (IoT) is upon us, and it is creating technology innovations and investment opportunities at breakneck speed. New technology innovations promise dramatic advancements in healthcare, agriculture, energy management, manufacturing, transportation, and many other applications in the very near future.

Wikipedia defines the Internet of Things as follows:

The Internet of Things (IoT) is the network of physical devices, vehicles, and other items embedded with electronics, software, sensors, actuators, and network connectivity which enable these objects to collect and exchange data. Each thing is uniquely identifiable through its embedded computing system but is able to interoperate within the existing Internet infrastructure.

The IoT allows objects to be sensed or controlled remotely across existing network infrastructure, creating opportunities for more direct integration of the physical world into computer-based systems, and resulting in improved efficiency, accuracy and economic benefit in addition to reduced human intervention. When IoT is augmented with sensors and actuators, the technology becomes an instance of the more general class of cyber-physical systems, which also encompasses technologies such as smart grids, virtual power plants, smart homes, intelligent transportation and smart cities.

"Things", in the IoT sense, can refer to a wide variety of devices such as heart monitoring implants, biochip transponders on farm animals, cameras streaming live feeds of wild animals in coastal waters, automobiles with built-in sensors, DNA analysis devices for environmental/food/pathogen monitoring, or field operation devices that assist firefighters in search and rescue operations. Legal scholars suggest regarding "things" as an "inextricable mixture of hardware, software, data and service".

The London School of Economics says: “The future is now and [this revolution] is going to disrupt most of the traditional industries.”

It will boost productivity, and save companies millions, likely billions, each and every year. In fact, it’s already happening.

Facebook announced that this breakthrough has already saved its data centers 38%.

UPS used this tiny innovation to reduce its fuel consumption by 9 million gallons ... a $31 million savings.

Governments are scrambling to invest in this, too.

- The City of Barcelona, Spain is an early adapter, and now its water system alone saves $58 million every year using this           innovation.

- The City of Glasgow in Scotland is investing $37 million in this as well.

Experts Predict 50 Billion Devices Will Utilize This New Technology by 2020. Early Investors Stand to Reap Tremendous Rewards as Its Growth Surges 8,000%...

That’s why companies are rushing at breakneck speed to get in on the action right now.

Cisco just invested $1.4 billion...

- IBM is investing $3 billion...

Google is investing $3.2 billion.

- The world’s greatest investor, Warren Buffett, through Berkshire Hathaway, has already invested a whopping $13 billion.

- Amazon, Samsung, Apple, Oracle, Ford, Disney, Tesla, Microsoft, Intel, Pfizer ... the list goes on and on.

Congressional Action

And it’s not just big conglomerates getting in on the action. The U.S. Government is fast-tracking a bill to support the Internet of Things.

Senators Deb Fischer, Cory Booker, Kelly Ayotte and Brian Schatz have sponsored a bill called DIGIT to help fast-track this breakthrough across America with federal assistance. The bill passed in the Senate on August 3, 2017 and is pending House approval.


The 8,000% ROI Play

Researchers are projecting this to make more millionaires than any other invention in history…

Watch the Full Video Report Here


MEMs – The “Eyes and Ears” of the Internet of Things

For the Internet of Things to work, you need sensors that can instantly transmit and retrieve information. At the core of sensor technology are MEMs (microelectromechanical systems). MEMS are tiny low-power sensors ... so tiny that 100 of them can fit on a dime ... some versions are just a thousandth of an inch in size.

The Internet of Things will be able to sense, think and act, but only with these sensors. They are, quite literally, the eyes and ears of the Internet of Things. That’s why investing in the right sensor company could mean life-changing profits in the next year.

These sensors will impact almost every aspect of your life. From the car you drive to the clothes you wear... from the energy you use to the food you eat... the entire world is about to undergo a massive transformation.

Imagine being able to stay in the comfort of your own home and stay active, and independent, for the rest of your life. With sensors that monitor your home and your health, it will be possible. These sensors will keep your doors and windows locked, they will remind you when it’s time to take your medication, when it’s time eat and when to get up and go for a walk.

But they will also keep your doctors, health professionals and loved ones connected to you as well. So, if you need a new pacemaker, your doctor will know it needs replaced. If you’re suffering from a fever, a loved one will be alerted to stop by to check in on you. If your heart is beating too fast, an ambulance will be sent to rush you to the hospital.

Imagine never losing your freedom or your independence ... with the Internet of Things, you won’t have to imagine much longer.

Again, this isn’t some technology out of a sci-fi movie... it’s knocking at our door and will be available at a dealership near you as soon as 2018, according to the former vice president of research and development at General Motors.

Cars will be talking to other cars, weather stations, the Department of Transportation, stoplights and the very road they drive on, in order to get you to your destination safely. And every one of these cars will have this little device in them. More on that in a moment. Cars are just the start.

The Internet of Things has already made its way into our homes, pockets and onto our wrists. You can already buy Internet-enabled thermostats, light bulbs, refrigerators, baby monitors, windows and toasters that observe your behavior and adjust to your liking. You can even buy a toilet that opens, closes, deodorizes, rinses, plays music and tracks usage via a mobile app.

Smartphones are used by 68% of U.S. adults. It is central to the Internet of Things. If I enable it to, it will track my every movement. It will know where I am and communicate location back to apps like Google Maps and Waze to determine where there are traffic jams. It will also tell me where my friends are, play music through my car speakers, check me out with the cashier at the grocery store and so much more.

Of course, there’s a lot more to the Internet of Things than just setting the ideal temperature, safely carting us around town and flushing toilets. Here are some other applications (Source: Wikipedia):

Agriculture

The integration of wireless sensors with agricultural mobile apps and cloud platforms helps in collecting vital information pertaining to the environmental conditions, including temperature, rainfall, humidity, wind speed, pest infestation, soil humus content or nutrients to improve quality and quantity, and minimize risks and waste.

Manufacturing

The IoT intelligent systems enable rapid manufacturing of new products, dynamic response to product demands, and real-time optimization of manufacturing production and supply chain networks, by networking machinery, sensors and control systems together.

Energy Management

It is expected that IoT devices will be integrated into all forms of energy consuming devices (switches, power outlets, bulbs, televisions, etc.) and be able to communicate with the utility supply company in order to effectively balance power generation and energy usage.

Transportation and Logistics

In Logistics and Fleet Management for example, The IoT platform can continuously monitor the location and conditions of cargo and assets via wireless sensors and send specific alerts when management exceptions occur (delays, damages, thefts, etc.).

We are just skimming the surface, but there is no doubt that the Internet of Things is going to revolutionize every industry on the planet.

The market for this technology will grow at an exponential rate – with some experts estimating growth from just $235 billion to a staggering $19 TRILLION in only four years.

The Internet of Things is Merely in Its Infancy

We are merely right here on the technology acceptance curve...

This is just the start of what promises to be a fast, profitable ride for early investors. In the years to come, the technologies behind the Internet of Things, specifically MEMs will explode in growth. Without these sensors, the IoT cannot exist.

Finding Gems in the IoT Space

A few leading sensor producers include Texas Instruments, Hewlett Packard and Bosch. Each company has strong profit margins ... and when demand surges, profits will skyrocket. The last time demand for sensors surged, the stocks of these companies did too. For example...

· Texas Instruments jumped from $24.82 to $59.28 ... a gain of 139%.

· Hewlett Packard surged from $5.65 to $18.48 ... a gain of 227%.

· Bosch went from $4,604 to $26,589 ... a gain of 477%.

But here’s the thing...there are smaller companies that are well-positioned for this type of growth and that have less exposure to other risks. Here’s an example:

Formed in the mid-‘90s, this European-based company’s CEO is a 40-year high-tech pioneer, and he’s using his industry contacts to lock in some stellar contracts. Investing in this corporate pioneer today will position you perfectly to enjoy a ride on the greatest technological wave history has ever seen.

In the last few months, Apple, Samsung and Bosch have already signed on to his firm’s sensors. Fact is, even if only a small portion of the estimated $19 trillion flows toward this $5 billion firm, the growth will be through the roof.

↓ Full Video Report Below ↓

The opportunity to invest in the Internet of the Future is enormous. Congress is paving the way to accelerate its progress, and the growth prospects are staggering. But as an investor, it is also important to stay informed on the emerging companies in this space, as well as keeping abreast of firms to avoid.

ABOUT THE AUTHOR


This article provided courtesy of ChartExperts.com

Chapter
02

Technical Analysis Indicators are NEVER Wrong

By Barry Burns, TopDogTrading.com

This brief tutorial demonstrates why charting indicators are always right, which has the tremendous benefit of allowing you to use them to create an objective, rule-based trading method. Why is this? Because indicators are not subjective, they are based on mathematical formulas. Math doesn't fudge outcomes - the same formulas will always generate the same results.

Some traders don't use indicators because most are lagging in their nature. While there is some truth to that, it's not the whole truth. If a trader focuses on price bars only, they are also lagging, because your trading assumptions are based on previously posted data.

The lesson in this video shows how to create an objective, rule-based trading method with a rarely used (but highly effective) indicator that helps you determine if the market is in a weak trend (which would stop you out) or a strong trend (which will follow through in your favor). 

THE MOVIE - WHY TECHNICAL ANALYSIS INDICATORS ARE NEVER WRONG


THE SPECIAL OFFER

Get my Free mini-course: "Make Money by Breaking Every Trading Rule You Ever Learned!" and get my favorite trade setup (the Rubber Band Trade) as another free bonus.

ABOUT THE AUTHOR

Author: Dr. Barry Burns
Company: Top Dog Trading
Website: TopDogTrading.com
Services Offered: Trading Education, Free Videos, Books
Markets Covered: Stocks, Options, Futures

Barry Burns is the founder and CEO of TopDogTrading.com. He is the author of Trend Trading For Dummies.He is also a regular presenter and contributor for several exchanges, including the CME Group and Eurex, as well as the author of Top Dog Trading 5 Energy Methodology Plug-in for MetaStock.​

Chapter
03

A Great Strategy For Capturing Powerful Trending Markets

By Steve Primo, ProTraderStrategies.com

Ask yourself this question: with the year nearly over, how is your trading going? Not getting the results you were promised? Join Steven Primo, former Stock Exchange Specialist and 40-year veteran trader, as he shares with you a very simple yet powerful method that can get your trading back on track for the last months of 2017 and into 2018.

Most traders fail because they try to pick the top and bottom of trends, which is ultimately a recipe for disaster. It’s been shown that you will have a higher level of consistency if you simply trade in sync with the trend as opposed to it. But with the help of a common indicator as well as pattern recognition, you now will be able to properly identify the beginning of a powerful trend.

In this educational webinar, Mr. Primo will reveal the basic entry rules to this trading strategy which can be applied to virtually any market, any direction, and any time frame.

THE MOVIE - A GREAT STRATEGY FOR CAPTURING POWERFUL TRENDING MARKETS


THE SPECIAL OFFER:

Get a 30-Day Trial of My PTS Primo Charts Program for just $7!

What you will get:

  • A full, 30-day trial of my program for just $7
  • You will get the trading strategy discussed in this video (Trading Strategy 3a)
  • "STEPS" 1 & 2 Entry Techniques for fine-tuning your entries into trades
  • Strategy Signal Scanner - Know which markets are triggered, according to the strategy
  • Enhanced "BUY/SELL" line, which signals when markets are trending up or down
  • Over 90 Technical Indicators
  • Free Bloomberg TV for fundamental analysis
  • Personalizedf Tech support for your individual needs

ABOUT THE AUTHOR

Author: Steven Primo, Founder
Company: Pro Trader Strategies, Specialist Trading
Websites:  ProTraderStrategies.com, SpecialistTrading.com
Services Offered: Trading Courses, Trade Signals, Member’s Section, Videos
Markets Covered: Stocks, Emini Trading, Forex, Day Trading, Swing Trading

Scores of students, from beginner to advanced levels, have gone on to become successful traders after being introduced to Steven’s proprietary methods of trading.

Chapter
04

A Powerful Winning Breakout Pattern - The Volatility Squeeze

By Larry Gaines, PowerCycleTrading.com

After decades of trading, I saw that there were just a handful of chart patterns that had the highest probability of producing winning trades.

Now, as a trader, it can seem overwhelming when you feel like you have to be an expert at recognizing dozens of chart patterns, along with the best security or EFTs, learning your broker’s platform, accounting for your trades, staying on top of the markets, possibly learning about options, and the list just goes on and on.

For this reason, I like to simply things by focusing on the "Highest Probability Winning Chart Patterns".

In this video series, I’ll show you my top chart pattern, "The Volatility Squeeze Breakout", with several examples so you can see just how explosive this pattern can be.

I'll show you this chart pattern on my ThinkorSwim trading platform using the proprietary trading indicators I have developed at Power Cycle Trading. These directional trading indicators make all trade setups much easier to spot which then makes them easier to trade.

THE MOVIE - A POWERFUL WINNING BREAKOUT PATTERN: "THE VOLATILITY SQUEEZE"


THE SPECIAL OFFER:
 

If you would like to learn more about this chart pattern and my other favorites, along with the directional trading tools we use, at Power Cycle Trading then use the link below and you'll receive one month access to our Power Cycle Trading Club for just $7.

Power Cycle Trading Club

Here is what you will receive:

  1. Virtual Trading room – Open from 9:25 AM until 4:15 PM EDT
  2. Daily Market Update Videos for Day Traders and Swing Traders
  3. Live Weekly Q&A with Larry
  4. Trader’s Education Vault
  5. Monthly Award Points - $20 credit for each month of membership. (Credits can be applied to all current or future courses)
  6. 50% Discounts on All Courses & Trading Software

ABOUT THE AUTHOR

Author: Larry Gaines, Founder
Company: Power Cycle Trading
Website: PowerCycleTrading.com
Services Offered: Trading Courses, Bootcamps/Coaching, Custom Indicators
Markets Covered: Stocks, Options, Futures

Larry Gaines has been involved in trading and brokering commodities and financial markets for over thirty years. Today, Larry trades options and futures, where he enjoys teaching others to generate income from trading using a disciplined systematic based on decades of trading experience.

Chapter
05

See The Hottest Stocks For Year-End

By Ron Haydt, Financhill.com

As we approach the strongest time of year (Holiday Season), knowing which stocks are set to soar or crash can be the difference between having a so-so year-end or a fantastic year-end.

How many times have you watched a stock all-of-a-sudden rip higher out of seemingly nowhere leaving you puzzled on how you missed it? Well, you can you leave those days behind you and instead of wondering how you missed the train leaving the station… you could be on that train!

How?  With just these three words… Proven Track Records.

Did you expect Disney to start roaring higher last November? In fact, from October 27 through April 10, the stock went from $93.30 to $112.43… a 20% stock gain.

Using near-the-money call options on Disney… An April $95 long call option on October 27 cost $4.20. As of April 10, it was worth a staggering $16.65 for a 296% gain. That means a $420 options contract could be worth $1,665.

How about the Airlines beginning their annual take off between November 1 and early December? Using near-the-money call options, UAL was up 264%, DAL was up 193% and AAL was up 140%.

In late December… well after the election… Adobe was lagging behind the rest of the market.  But we showed how Adobe historically turns very bullish as January begins. Result?  From January 6 to April 10, the stock jumped $21.86/share (+20%). A July $110 long call option over that same time period went from $7.10 to $20.60 per share for a stunning 190% gain.  Meaning, $710 could be worth $2,060.

How about Domino’s Pizza blowing the doors off Papa John’s during the ‘Big Game’ period in Jan & Feb… or EW’s massive gap and run higher in April & May (long call up 160%)… or how about CELG’s recent big move higher (long call up 137% in just 7 days).

THE MOVIE - THE HOTTEST STOCKS FOR YEAR-END


THE SPECIAL OFFER

Come see what so many traders are already raving about…

Grab your completely complimentary no credit card required trial right now and instantly see which stocks are set to soar in the days and weeks ahead… and which stocks to avoid.  You have absolutely nothing to lose and everything to gain.

Go here now and let’s make this upcoming holiday season the best yet!

P.S.  Our no credit card required complimentary trial is coming to an end very soon.  Get your totally free trial now and instantly see the hottest stocks for the days ahead before it is too late. 

P.P.S.  As a special bonus for grabbing your trial today, you’ll also receive an invite to a private member’s only session… so keep an eye out for our email this week.

ABOUT THE AUTHOR

Author: Ron Haydt, President
Company: Financhill
Website: Financhill.com
Services Offered: Stock Screening Software, Daily Newsletter
Markets Covered: Stocks, Options, ETFs

Ron has taught thousands of traders from all over the world. He's passionate about helping other retail traders protect and grow their stock market portfolio through the application of options instruments. Options trading can often sound very complicated and Ron loves to keep it simple, use proper risk management and improve the trader's overall results.

Chapter
06

THE FOREX FORMULA FOR SUCCESS

By Scott Barkley, ProActTraders.com

Is there a formula that will help a trader learn to ultimately become successful in the Forex?

YES! And here it is: Trade For Pips Daily

Obviously, this is what we want to do each day, but the above is a mnemonic.  A mnemonic is an easily memorized saying in which the first letter stands for something I need to know.

T = Trend

F= Fibonacci ratios

P= Previous support/resistance

D= Divergence

Now the interesting thing is that when the above comes together on a chart we will see what we call Wide Open Spaces (WOS)and we can also see that the “Big Boys” almost always run those big areas in just a short while.  So, guess where your trade is hiding? In those Wide-Open Spaces.

We can figure out the “Big Boys” by using technical analysis. This is where most traders fail to truly put their effort. Most traders opt for a shortcut because they want to make money fast. Technical analysis is time consuming and requires real work in the charts and it is NOT trading. Technical analysis forces us to find all the areas where we CANNOT trade, so that the only thing left in the chart is an area where we CAN trade. In other words, a Wide Open Space.

Mark Twain said this: "The dictionary is the only place where success comes before work."

Traders erroneously think (as I once did) that this market is simple and should propel you into stratospheric money making in weeks. This is not so. Most traders can see the market (after the fact) but make the mistake of not understanding the why of the market move and concentrate on just getting an entry and then clicking their profit out way too soon.

To be successful, you must learn to “LET YOUR WINNERS RUN and CLICK YOUR LOSSES OUT EARLY”.  Unfortunately, for the vast majority of traders it is just the opposite.  We “LET OUR LOSERS RUN and CLICK OUR WINNERS OUT EARLY”.  Why is this?

For most traders, it is a combination of the emotions of fear and greed and the lack of knowledge in analyzing the market. Most novice traders don’t know where the market will go so they take any small profit just so they can have a winner.  Sound familiar?  If you take only 5 pips on a trade and then accept one loser with a 30 pip stop, it takes you 6 trades in a row just to break even. You must have 90%+ winners to 10 % losers to stay ahead of this losing curve. If you can do that, then you are one of the greatest traders on the planet. If not, keep reading.

Real Professional Traders know exactly where the market is trying to go and they do everything in their power to stay in the trade until that destination is reached. In other words: they analyze the market, determine where it should go, then at the opportune moment, they enter the trade (not too early or you live with a large drawdown – a move against you), manage it to a profitable position and then manage it to the destination.

Surprisingly, this analysis is not that hard, has predictable results and does not require that you be a rocket scientist. There are four things that you must know.  If you know these four things you should have a fairly good idea of where the “Big Boys” are going.  

In our workshops, we call this being the “tick on an elephant”. In the wild, an elephant can go pretty much wherever it wants to go. The Elephant is the “Big Boys” – bankers who are the ones who really move the market. We are the tick - we just want to bite onto the elephant and go wherever he is going.

“Big Boys” (the elephant) have a vested interest in going to certain places in the market.  Why, is a secret I can’t tell you (or I’d have to kill you as the movie says HA!), but suffice it to say that their destination is predictable, whether going long or short. 

Here is a graph showing how the market is made up.  Keep in mind that according to Aite Group LLC : of the estimated 5.3 trillion dollars traded in the Forex each day, 400 billion dollars is retail money.

If we add the other top 5 banks into the mix 73% of all the volume is created by these few participants.

So, one of the keys to being successful is to find out what the participants who control 73% of the market are trying to accomplish today.

As these “Big Boys” create structure in the market, the “follow through”, the other 500-800 banks, sovereigns and hedge funds recognize what the Big Boys are trying to do and they join in.

The “Big Boys” get paid to create a structure in the market that the other players can identify and then trade to that completion. The “follow through” gets paid for recognizing the market and accomplishing the trade the “Big Boys” wanted and taking it to the target. To unlock this code that the “Big Boys” are using, we meticulously look at a currency through the eyes of Technical Analysis using the T.F.P.D as our guide to understanding the structure of the market. 

For example, if a trend is present we know that 73% of how it was made was the “Big Boys” and now we know a piece of their agenda. The direction of the trend tells the market where the “Big Boys” want the market to head. The barriers to just simply going to that target are Fibonacci ratios and previous support or resistance depending on direction.

A trend is a sustainable move but, our trades will exist in areas without barriers but in unsustainable movements. Therefore, it is important to identify the barriers since these are the targets and the turning points for retracements and pullbacks.

In the above sustainable up trend (red lines), you can see how the unsustainable moves (yellow boxes) were halted by a barrier.  The trend was sustainable but the trades were not.  Since most retail traders don’t want to take the time to learn how to extract this information out of the chart, they have no idea where the market is trying to go and so as soon as they see any indication that the market is moving against them, they bail on the trade for typically 5-8 pips or so.  The Pros however, take the unsustainable move to the target and then exit their trade and wait for the next opportunity.

The areas between these barriers are what we call the Wide-Open Spaces. These are areas with little or nothing to stop the movement once it starts.

Wide Open Space

So, when you do this work on a chart it reveals what the Big Boys want to happen. It also reveals where the best opportunities are to accomplish the overall goal of the Big Boys. And it is these areas (WOS) where you can take advantage and trade with the big Boys. So, guess where your trade is hiding?  ALWAYS, in those Wide-Open Spaces. Also, remember, that these Big Boys are not trading for a measly 5-8 pips.  They are trading for hundreds of pips, so NO CLICKING out for 5!

THE SPECIAL OFFER

We teach Target Trading in the Wide-Open Spaces every day in our live room in both the London and the New York sessions.  If you come and sit in one of our rooms, you will see traders just like you make hundreds of pips.  You can sit in the room for 7-days and just watch if you like.  You can also get a 10-day trial of our amazing charting software that is designed to help a trader find the WOS and the momentum in the market.

Both of those are FREE! 

ABOUT THE AUTHOR

Author: Scott Barkley, Co-founder
Company: ProAct Traders
Website: ProActTraders.com
Services Offered: Trading Education, Software, Trading Room
Markets Covered: Forex

Scott Barkley is a co-founder of ProAct Traders and is an award-winning Forex Trainer who has mentored students all over the world since 2004.  ​

Chapter
07

VOLUME SPREAD ANALYSIS – THE KEY TO TRADING IN HARMONY WITH THE SMART MONEY

By Gavin Holmes, Tradeguider.com

Most traders are aware of the two widely known approaches used to analyze a market: fundamental analysis and technical analysis. Many different methods can be used in each approach, but generally speaking fundamental analysis is concerned with the question of why something in the market will happen, and technical analysis attempts to answer the question of when something will happen. Volume Spread Analysis, however, is a third approach to analyzing a market. It combines the best of both fundamental and technical analysis into a singular approach that answers both questions of 'why' and 'when' simultaneously.

Introduction to Volume Spread Analysis

Volume Spread Analysis (VSA) methodology takes a multi-dimensional approach to analyzing the market, and looks at the relationship between price, spread or range, and volume. VSA is a proprietary market analysis method conceived by veteran trader, Tom Williams, who was a highly successful member of a professional trading syndicate in the 1960s and also the creator of TradeGuider Systems. The VSA method works particularly well at highlighting the imbalances of Supply and Demand.

VSA builds on the pioneering work of Richard D. Wyckoff, a famous 1920's trader. He based his trading decisions on supply and demand in the markets and how they are inextricably linked to professional activity - 'Smart Money' trading (Wyckoff's principles are still taught at the Golden Gate University in San Francisco). In any business where there is money involved and profits to make, there are professionals. Doctors are collectively known as professionals, but they specialize in certain areas of medicine. The financial markets are no different. The financial markets have professionals that specialize in certain instruments as well: stocks, grains, FOREX, etc. The activity of these professional operators, and more important, their true intentions, are clearly shown on a price chart if the trader knows how to read them. Volume is the major indicator for the professional trader.

Volume Spread Analysis seeks to establish the “cause” of price movements, and from the cause, predict the future direction of prices. The cause is quite simply the imbalance between Supply and Demand in the market, which is created by the activity of professional operators. It is the close study of the reactions of these specialists, market maker professionals, or “Smart Money”, which will enlighten you to future market behavior.

VSA looks at the interrelationship between three variables on the chart in order to determine the balance of supply and demand as well as the probable near term direction of the market. These variables are the amount of volume on a price bar, the price spread or range of that bar (do not confuse this with the bid/ask spread), and the closing price on the spread of that bar. For the correct analysis of volume, one needs to realize that the recorded volume information contains only half of the meaning required to arrive at a correct analysis. The other half of the meaning is found in the price range. Volume always indicates the amount of activity going on and the corresponding price spread shows the price movement on that volume.

The effect is either a bullish or bearish move according to the prevailing market conditions. The ‘Smart Money’ operating in the markets are very much aware of the emotions that drive YOU, and the uninformed traders or investors, in your trading.

Why do the members of the self-regulated Exchanges around the world like to keep true volume information away from you as far as possible? The reason is because they know how important it is in analyzing a market! The significance and importance of volume appears little understood by most non-professional traders. Perhaps this is because there is very little information and limited teaching available on this vital part of technical analysis. To use a chart without volume data is similar to buying an automobile without a gasoline tank.

Where volume is dealt with in other forms of technical analysis, it is often viewed in isolation, or averaged in some way across an extended timeframe. Analyzing volume, or price for that matter, is something that cannot be broken down into simple mathematical formulae. This is one of the reasons why there are so many technical indicators; some formulas work best for cyclic markets, some formulas are better for volatile situations, whilst others are better when prices are trending.

Some technical indicators attempt to combine volume and price movements together. This is a better way, but rest assured that this approach has its limitations too, because at times the market will go up on high volume, but can do exactly the same thing on low volume. Prices can suddenly go sideways, or even fall off, on exactly the same volume. So, there are obviously other factors at work.

Price and volume are intimately linked, and the interrelationship is a complex one, which is the reason Volume Spread Analysis was developed in the first place.

EXAMPLES OF MARKET MANIPULATION

So why do so many traders lose?

They lose because they have not grasped some fundamental facts which drive all markets.

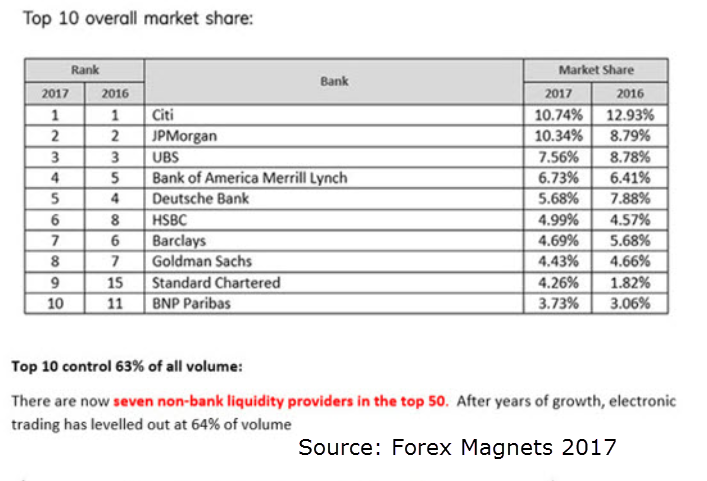
Fact number 1; By far the largest players in the market are the hedge funds, investment banks, trading syndicates, such as Goldman Sachs, George Soros and Berkshire Hathaway headed up by Warren Buffet. These are organizations you have hears of. There are many, many others who are not publicly known, but together, they are by far the biggest players in the international trading community. At Tradeguider we call them the “Smart Money”

Fact number 2: The “Smart Money” have to make money and they do this by selling at the top of the market and buying at the bottom.

Fact number 3: In order to do this, they have to move the market so that the price rises to the top or falls to the bottom.

Markets have always been manipulated here are just a few examples:

Let’s begin with the British Petroleum oil spill disaster in 2010. On the 25th June that year the shares fell to just under 27 dollars. the news was grim the pundits and reporters were talking in terms of huge losses and a possible break-up of the company and everyone who had shares was looking to sell in full expectation that prices were plummeting.

And sell they did - straight into the hands the smart money professionals who bought cheap.

Within six months the price of the stock doubled - buy cheap, sell back when the market rises. That’s how the game is played.

On May 6 2010 something very strange happened in the financial markets. This day is now referred to as the flash crash because no credible explanation has been provided by the regulatory authorities as to exactly what caused the crash or who was responsible.

In fact, many investors begin to suspect the all was not what it seemed to be.

CNBC's closing bell anchor-woman Maria Bartiromo was reporting on the day the flash crash happened. Fellow reporter Matt Nesto was explaining some unusual anomalies in a number of stocks - even though the mainstream media claims that is was caused by a lone trader hitting the wrong button - B for billion instead of m for million - Maria saw through it straightaway. She called it an outrageous example of Market Manipulation.

What we actually witnessed on May 6 was a giant shakeout of the market. The smart money was expecting higher prices and wanted to catch the retail traders, by marking the price down heavily, before moving the price up. They were bullish the stocks were going to rise and they want to buy at the best possible price - wouldn't you want to do the same?

Buy at the lowest price name knowing you could sell it later for much more than you bought it for

In February this year we saw the headline

“Qantas soars to record half year profits”.  is the headline on February 25rd 2016 "Lower oil prices have helped Qantas post a record pre-tax profit " and "best first-half profit in the Australian airline's 95-year history" are used directly below the headline. All the news is now bullish the stock has been going up and up because it is in an uptrend. To the retail trading and investing community the appeared to be a great opportunity to buy the stock because everything lined up and if you didn't go into the market by now you'd miss the move, okay so buy, buy, buy!

What happened? the stock plummeted spectacularly and the uninformed retail traders said “bye-bye” to their capital.

That's the trading game - buy low sell high. Be a predator, a clever predator that understands exactly how the prey think and act

Smart Traders appreciate this and understand that quite often, all is not what it seems. The media, the sentiment and the emotions will often lead to poor trading decisions and big returns for the professionals.

The good thing is that whilst the Smart Money try and disguise their activity there is one place where they cannot hide.

The price chart.

The History of VSA

As mentioned earlier, this is not a new concept. Tom Williams, the inventor of VSA, is a former syndicate trader. He observed that the markets were being manipulated and that the key to unlocking the truth lay in the relationship among the Volume, the Spread of the bar, and its Closing Price. Tom spent many years studying the concepts of Richard Wyckoff, a renowned trader during the 1920’s and 1930’s. Richard wrote several books about trading the Markets, and he eventually created the Stock Market Institute in Phoenix, Arizona. At its core, Wyckoff’s work is based on the analysis of trading ranges and determining when the stocks are in basing, markdown, distribution, or mark-up phases. Incorporated into these phases are ongoing shifts between ‘weak hands’, or public ownership, and ‘the composite operator’, now commonly known as ‘Smart Money’.

When Tom Williams went back to Beverly Hills in the early 1980’s, he began to investigate the possibility of computerizing the system he had learned as a syndicate trader- and so began the evolution of Volume Spread Analysis (VSA). With the assistance of an experienced computer programmer, Tom carefully studied thousands of charts to recognize the obvious patterns that were left when professional operators, or Smart Money, were active. This technique, although simple in concept, took several years to write and is now taught as a methodology in combination with software known as TradeGuider.

The Key Players

There are a few specific individuals involved in the evolution of what VSA is today, as well as a handful of experts that teach the Volume Spread Analysis method and its principles.

RICHARD DEMILLE WYCKOFF

Richard D. Wyckoff worked in New York City during a “golden age” for technical analysis that existed during the early decades of the 20th Century. Wyckoff became wealthy through trading in the stock market, but he also became altruistic about the public's Wall Street experience. He turned his attention and passion to education, teaching, and in publishing exposés such as “Bucket Shops and How to Avoid Them”, which were run in New York’s “The Saturday Evening Post” during the 1920’s.

As a trader and educator in the stock, commodity and bond markets throughout the early 1900s, Wyckoff was curious about the logic behind market action. Through conversations, interviews and research of the successful traders of his time, Wyckoff augmented and documented the methodology he traded and taught. Wyckoff worked with and studied them all, himself, Jesse Livermore, E.H. Harriman, James R. Keene, Otto Kahn, J.P. Morgan and many other large operators of the day.

Wyckoff's research claimed many common characteristics among the greatest winning stocks and market campaigners of the time. He analyzed these market operators and their operations, and determined where risk and reward were optimal for trading. He emphasized the placement of stop-losses at all times, the importance of controlling the risk of any particular trade, and he demonstrated techniques used to campaign within the large trend (bullish and bearish). The Wyckoff technique may provide some insight as to how and why professional interests buy and sell securities, while evolving and scaling their market campaigns with concepts such as the "Composite Operator".

Wyckoff felt that an experienced judge of the market should regard the whole story that appears on the tape as though it were the expression of a single mind. He felt that it was an important psychological and tactical advantage to stay in harmony with this omnipotent player. By striving to follow his footsteps, Wyckoff felt we are better prepared to grow our portfolios and net-worth.

Wyckoff was a keen observer and reporter who codified the best practices of the celebrated stock and commodity operators of that era.  The results of Richard Wyckoff’s effort became known as the Wyckoff Method of Technical Analysis and Stock Speculation. Wyckoff is a practical, straight-forward bar chart and point-and-figure chart pattern recognition method that, since the founding of the Wyckoff and Associates educational enterprise in the early 1930’s, has stood the test of time.  Around 1990, after ten years of trial-and-error with a variety of technical analysis systems and approaches, the Wyckoff Method became the mainstay of The Graduate Certificate in Technical Market Analysis at Golden Gate University in San Francisco, California, U.S.A.  During the past decade dozens of Golden Gate graduates have gone to successfully apply the Wyckoff Method to futures, equities, fixed income and foreign exchange markets using a range of time frames.

The following are the three fundamental laws of the Wyckoff Method will be defined and applied

1. The Law of Supply and Demand – states that when demand is greater than supply, prices will rise, and when supply is greater than demand, prices will fall. Here the analyst studies the relationship between supply vs. demand using price and volume over time as found on a bar chart.

2. The Law of Effort vs. Results – divergences and disharmonies between volume and price often presage a change in the direction of the price trend. The Wyckoff “Optimism vs. Pessimism” index is an on-balanced-volume type indicator helpful for identifying accumulation vs. distribution and gauging effort.

3. The Law of Cause and Effect – postulates that in order to have an effect on you must first have a cause, and that effect will be in proportion to the cause. This law’s operation can be seen working as the force of accumulation or distribution within a trading range works itself out in the subsequent move out of that trading range. Point and figure chart counts can be used to measure this cause and project the extent of its effect.

TOM WILLIAMS

Tom Williams is the founder of TradeGuider Systems Software (formerly Genie software) and initiator of the Volume Spread Analysis methodology- he was also a very successful syndicate trader in the U.S. Tom was introduced to day trading while working in Beverly Hills for a boss of an elite group of trading syndicates. These trading syndicates revealed their successful strategy to Tom. He gained their trust and confidence and soon became an established member of their organization.

Tom began hand-drawing the charts that the pool would use to make their speculative attacks, and while doing this, he recognized a relationship between price movement, the volume, and where the price closed. The syndicates decided it was time to send Tom to the Wyckoff Chart Reading course in order for him to understand and finally get a firm grasp of exactly what was going on in the markets, especially when he drew these charts. Tom realized all the clues to make wining trades were in the charts, if you knew how to read them correctly.

Williams retired from professional trading at the age of 40, taking up a number of commercial ventures during this period. Tom continued to trade as well, but became consumed with all the knowledge he had learned from the syndicate and it’s traders back in the United States. Tom's real ambition was to help traders operate in a more informed way, and this idea formed the basis of his software development company, Genie Software Ltd. He wanted to computerize the Wyckoff Method and the knowledge he had gained from that course to produce automated trading signals that did not have to rely on human intervention. Tom further developed Wyckoff's methodologies to create his own more potent methodology - Volume Spread Analysis - regularly referred to as "Wyckoff on Steroids"!

Tom has spent many years refining the signals in this flagship product, VSA (The forerunner to TradeGuider) to make TradeGuider Software Systems what it is today. He also wrote two books that he self-published, “The Undeclared Secrets that Drive the Stock Market” and “Master the Markets”. Both books have now sold or been distributed to over 100,000 traders and investors worldwide.

Tom Williams has been energetically and successfully applying his unique methodologies for the last 30 years to the Stocks, FOREX and Futures markets.

Using Volume Spread Analysis in Your Trading

Volume Spread Analysis was previously known as Wyckoff Volume Spread Analysis and has been in existence for over 20 years. Driven by an artificial intelligence engine, TradeGuider VSA is unique and is capable of analyzing any liquid market in any time frame by extracting the information it needs in order to indicate imbalances of Supply and Demand evident in a chart. In doing so, TradeGuider is able to graphically exhibit the essential dynamics of market movement.

Volume Spread Analysis (VSA) is at the core to the Tradeguider trading solution – the VSA SMART Center Pro.

The VSA SMART Center Pro is a complete revolutionary trading system which has become a game-changer for the international trading community. 

From time to time in the history of international trading key milestones are reached.

From the realization in the 1900’s by Richard Wyckoff that markets were moved by the Composite Operator to Richard Ney's ground-breaking work in in the 1950's.

In the 1980's Tom Williams built on the original Wyckoff methodology to introduce Volume Spread Analysis.

And now the VSA SMART Center Pro marks a huge milestone by making the process of trading and investing substantially easier and quicker. Than ever before.

The VSA SMART Center Pro Package consists of 2 key elements:

  1. An innovative new educational program based around a simple 3 part trading strategy
  2. A revolutionary new piece of trading technology - The VSA smart CENTER PRO - that will make the whole trading process much easier and intuitive.

WHY DO YOU NEED IT

Do you find the business of analyzing charts laborious and time consuming?

When you do find trades do you find it difficult to identify successful entry points?

When you get into a trade do you have problems finding the optimum exit?

And have you ever entered a trade convince the time was right only to find the market immediately changes direction?

Would you rather spend more time taking and managing trades, then searching for them?

If any of these strike a chord with you then welcome to VSA SMART Center Pro

VSA SMART Center Pro uses Volume Spread Analysis - a unique and powerful methodology. It is neither Technical Analysis or Fundamental Analysis. On their own technical and Fundamental Analysis do not take into account 3 absolutely crucial factors:

  1. The markets are moved by supply and demand – no technical analysis tools can predict this
  2. You cannot use past price to determine future price in the markets. Because the markets are moved dynamically – that’s why the market turns just when you didn’t think it was going to.
  3. The supply and demand are created dynamically by the “Smart Money” players who continually move the markets. Neither Fundamental or Technical Analysis can identify this activity.

These 3 factors cause the huge majority of retail traders and investors to lose money in the markets.

The good news is that Volume Spread Analysis methodology focuses on the imbalance of Supply and Demand. It does not use past price to predict future price. Instead it tracks the activity of the Smart Money enabling you to trade in harmony with the professional winners.

It’s the methodology the Smart Money don’t want you to know about and it is over 100 year old and still taught as part of the finance degree at the Golden Gate University in Sen Francisco.

HOW DOES IT WORK IN PRACTICE?

VSA SMART Center Pro is a trading system which is built around the Tradeguider 3 part trading strategy Scan Confirm Trade.

The trading system plugs directly into many of the leading trading platforms to bring the SMART tools onto the charts in the 3rd party platform.

The first stage of the Scan Confirm Trade process is scan.

SMART Center pro dynamically scans up to 24 instruments in real time.

Each instrument has its own scanner. The information in this scanner is them summarized in the SMART Console window which can monitor up to 23 more instruments

When the trend is aligned in the individual scanner the trend is confirmed for that time-frame in the monitor.

So in summary the SMART Center Pro is analyzing trend alignment, across the time frames, using our proprietary trend analysis tools.

When they identify trend alignment, the system automatically issues an audio alert.

The audio alert is complimented by the instrument flashing in the Monitor window.

When an alert has been received you have completed the first of our 3 stage process = The SCAN stage

A potential trading candidate has now been identified. Clicking anywhere In scan summary area initiates stage 2 – CONFIRM 

The SMART Center then scans across the time frames for a confirmation signal.

Confirmation signals are VSA principles which confirm a change in direction. When a VSA confirmation signal arrives, again you will be notified

Again the box will flash in a different color. Now you have completed stage 2 - CONFIRM

To enter the 3rd stage of our trading process – TRADE – you open the chart the signal has appeared on and use you skills as a trader to decide to take the trade.

Once you are in the trade the trending tools and the stop management tools keep you in the trade for as long as your risk management criteria allow.

And that’s it –  a simple clear process which works across all time frames, any market and every trading style.

Most of the tools are configurable through the settings panel which enables you to set up the tools, configure them, change color schemes and set up your watch list of trading instruments.

THE MOVIE

Click Here to see a YouTube video of SMART Center Pro in action.

THE SPECIAL OFFER

You can make it in the markets and be successful, but you will need to embrace the 
paradigm shift of Volume Spread Analysis (VSA) in your thinking and trading toolset.

As a thank you for reading our chapter and to find out more about the VSA methodology

ABOUT THE AUTHOR

Author: Gavin Holmes
Company: Trade Guider
Websitewww.TradeGuider.com
Services Offered: Trading Education, Books, Videos, Trading Alerts
Markets Covered: Futures, Forex, Stocks

Gavin Holmes' passion is based on the original teachings of Richard Wyckoff, Richard Ney, and Tom Williams who all had the same goal, to educate the uninformed public.

Chapter
08

An Options Strategy When Markets are at All-Time Highs

By Geoffrey A. Smith, DTItrader.com

It has been my experience over the past 25 years that most traders like to trade options.  I can't blame them, since options are cheap and allow them to control 100 shares of stock, or one futures contract, for very little expense. I'm a commodity trader myself for the most part, but like playing the option market in equities. There are those who like to sell options (write options), and those who like to buy options. I do both, depending on the market conditions. In trending markets, you make more buying options, in chewy, quiet markets, you make more selling premium and avoid the time decay when buying options.

The problem in today's market (don't really know if it a problem) is that just about everything is trading at the all-time highs. The markets are on a roar. Because of this, buying call option spreads are a bit risky because you cannot get any premium for the short call in the spread (the stock has never been there so the premium is low). Below is a daily chart of Home Depot (HD).  It has an all time high of 166.63 and is trading at 166.10.  If you look to buy a 165/170 call spread, the 165 call will cost $2 to $3, but the 170 call is only worth .20¢. That does not help a whole lot. So, it may just be better to buy the call outright.

HD Daily Chart

There are other ways around this. In the case of HD, it is trading at the highs (retail). What we want to do is buy it at wholesale, in other words, we want it to pull back to give us some room to "play". What I look for is a stock that has a nice up trend, and has pulled back into support. Then start looking at buying call spreads.

Let's look at another example. Below is a daily chart of Apple (AAPL). Notice it has an all time high at 163.96, and a recent high at 160.90. It also has pulled back and holding support around 155. In this case, AAPL has room to move up and we can look at buying the 155/160 call spread and possibly do a little better. A couple of weeks out, the 155 call is 4.50 and the 160 call 2.02.  Since AAPL has been to 160 before in life, the market knows that it can get there, and therefore we can get more for the short call.

AAPL Daily Chart

There are various ways of trading in the market. Using the same technique, as AAPL is holding support at 155, one could sell the 155 put (naked or write a put). In doing so, you will pull in the premium from the sold put. If the stock goes up, the premium will decrease because it is getting further away from the strike price, and you are taking advantage of time decay. If on expiration AAPL is above 155, you keep all the premium and the trade is done. However, if AAPL is below 155 on expiration, the stock will be put to you. You will then own 100 shares of AAPL at 155. But remember, you brought in premium from the put you sold. You can then sell a 160 covered call, again bringing in premium. If AAPL does not close above 160 on expiration, you keep the premium and are still long AAPL. If it does close above 160 on expiration, you keep the premium and make $500 on the stock.

Let's do the math on both scenarios to help explain. First, the call spread, this is the cheapest way of trading the long side. You buy the 155 call for 4.50 and sell the 160 call for 2.02. Since the bought call cost $450 and the sold call cost $202, your net debit is $248. The difference between the 155 call and 160 call is $5 or $500. So the maximum profit is $500 – $248 = $252.  Your maximum risk is $248 (what you paid for the spread).

The second scenario takes more time and money. Assume it is Wednesday and one sells next week's 155 naked put for 1.31. This is a credit of $131. If it is not below 155 on expiration, you keep the $131. If it does close below 155, then you keep the $131, and are long 100 shares AAPL from 155. You will need $15,500 for a cash account or $7,750 for a margin account to buy 100 shares of AAPL (this is also the margin required to sell the naked put). You then go out 2 weeks and sell the 160 covered call against the stock for 2.08 ($208). At this point, you have brought in $131 from the naked put and $208 from the covered call for a total of $339 in premium. If AAPL sells off, you will not lose money until it gets below 151.61 (155 – 3.39 = 151.61). 

Notice on the chart above that the next support is around 152, so you have financed the trade below 152 on the stock. If the stock gets below 152 and you exit the stock, you will also need to exit the covered call, or you will then have a naked call (you can keep it if you like and see if it deteriorates to zero and keep all the premium, but if AAPL rallies and closes above 160 on expiration, you could end up short the stock). So if that happens, you will not get all the premium from the 160 covered call that you sold, but most of it, since it has declined in price (further from strike) and have had time decay. So you break even on the trade (very little or no risk).

If AAPL rallies and closes above 160 on expiration, AAPL will be called away from you at 160.  You owned it from 155 and sold it at 160 for a profit of $500.  But we also brought in $339 of premium for a total of $839 in profit.  Risk next to zero to make $839...not bad.

There is another scenario that we need to discuss, what if AAPL is above 155 but below 160 on expiration. This is almost better that making the $839, because we get to keep the 100 shares of AAPL and keep the $339 in premium from the options sold.  So sell another 160 covered call for the next week and see what happens. If you look at the low on the AAPL chart above at 149.16, you might be able to bring in enough premium to finance below that.  So now you can risk $500 on AAPL and lose nothing, or if they call it away, you can make over $1000 with virtually no risk.

One thing to keep in mind when selling premium, as the stock gets closer to strike the price will increase the option's premium. This will show a loss in your account. This is where most forget about the end game and concentrate on the current market. They begin to panic because they are losing and bail the trade for a loss. Remember, we are trying to acquire the stock, hence we sold a put. On expiration, if the underlying security is below the strike price of the sold put option (in the money), the stock will be put to use and we keep the premium from the sold option and now have the stock that we can sell covered calls against.  We want the premium to increase to get the stock.  So really, we are not losing money, just getting closer to owning the stock.

The point is to find a stock that has pulled into support, held support, and has room to move from support to resistance. Trying to buy stock at all time highs is hard to swallow, especially for option traders. But now you have a couple of tools to help you navigate the stocks to want to trade and help you minimize risk, and maximize gain.

THE SPECIAL OFFER

Sign up now to get DTI’s Trade Room for the remainder of November for $9.  This is a 24 hour trade room for traders.

ABOUT THE AUTHOR

Author: Geoffrey A. Smith, Chief instructor
Company: Diversified Trading Institute
Website: DTItrader.com
Services Offered: Trading Education,  Software, Trade Alerts
Markets Covered: Stocks, Options, Futures, Forex

An active trader and investor for 30+ years, Geof focuses in futures, equities and option trading including trading commodity option futures. 

Chapter
09

THE 6 KEYS FOR SUCCESSFUL TRADING AND ACTIVE INVESTING

By Serge Berger, TheSteadyTrader.com

You may want to trade or actively invest your money because of your interest in the financial markets and strong aspirations of becoming a trader and investor and living a life of financial freedom. Or you may want to trade because you’ve earned enough money and now want to be free of a boss, enjoy life, and yet still earn an income. Whatever the reason for being interested in this lifestyle, this profession if approached the right way will allow you to actively manage money in all market situations while having the freedom to work for yourself. You will want to be a student of the markets and gain an appreciation for some of the things that are critical for success. Proper mindset, strict money management, and trading/investing with a clear plan are a few of the more important aspects to focus on when actively participating in the markets.

Keep it Simple - the KISS Principle

The typical investor and trader makes things much too complex. True, an unlimited amount of variables can influence the direction of the stock, currency and commodity markets, but that’s exactly why keeping it simple is so crucial for success in this business. Since our analysis will never be able to catch all possible variables, particularly in this ever more globally interconnected economy, we must find an approach that focuses on a finite set of checkpoints or else risk analysis paralysis. Overthinking is one of the primary reasons why many active market participants do not make money.

Traders and investors need a simple BUT a repeatable process. Novice traders often come into this business, trying out a new ‘technique’ each day, which in turn never allows them to see which approach actually works best for them.

Trading and investing techniques, or systems or approaches - whatever we want to call them - also make it more challenging for market participants to stick to the ‘rules’ of those systems.

A simple but repeatable process allows market participants to stick to their rules and get in and out of the market in accordance of those rules and leaves emotions at bay.

Stay Away from Nervous Day-Trading

The unfortunate reality is that too many novice traders and active investors come into this business thinking that day trading is the solution to their financial aspirations. This tainted reality comes with the allure of quick riches from nervously battling the flickering ticks all day long. More than 90% of wanna-be day-traders ultimately fail, often mentally exhausted and with significant drawdowns in their brokerage accounts. This reality of course is never told by those trying to sell you the ‘surefire’ day trading signal or worse, lure you into a day trading chat room where most of the time the moderators/traders don’t even trade real money.

The truth is that the intraday time-frame is by far the most challenging to succeed at. The constant news flow, algorithms and market makers gunning against traders can quickly push traders out of positions and lead to maximum frustration. Traders then quickly begin to over trade and worse, revenge trade (trying to get back their money), which of course inevitably leads to more losses.

Furthermore, few people have the time nor true desire to nervously sit in front of their computer screens all day and being at the whim of the next piece of news flow or algorithm to take their money.

Luckily there is a better way that not only fits most people’s lifestyles and time availability, but also has a massively higher probability of success. I call it ‘Swing Trading’ or ‘Active Investing’ and it is all about the multi-day to multi-week time-frame.

Trade the Swings

Why Swing Trading or Active Investing

  1. No stress, no boredom: Swing trading captures a sweet-spot in the world of trading when it comes to time-frames. Swing trading doesn’t require the trader to be glued to the screens all day, nor is it too hands off. Swing traders can check on the markets a couple of times per day, while maintaining their day job, hobby or whatever else keeps them busy.
  2. Comfortable holding time-frames: The typical holding period for a swing trading position is anywhere from two days to multiple weeks. This time-frame allows individuals to follow the news flow and price action without having to worry about the intraday ticks and noise.
  3. Un-crowded trades: The holding periods of two days to four weeks is too long for day traders and typically too short for institutional investors, hence allowing us to profit from less crowded trades with clean patterns.
  4. Plethora of setups: Swing trading yields a steady stream of trading setups every week and month.
  5. Defined risk: Every new trade automatically has a clearly-defined stop-loss level and profit target. No emotions, just a focus on flawless execution.

What is a Swing

Swings come in different durations. The focus on my swing trading approach is to capture the swings lasting anywhere from two days to four weeks. The below charts show classically what such swings look like. Swings can also occur within a bigger swing, such as the chart on the right displays. Because identifying a swing is mostly done in hindsight, my strategy tries to either 1) Capture the first few % of a new swing based on clear trend exhaustion signals, or 2) Capture the middle part of the swing based on breakout patterns

Trade/Invest with the Trend

Over time any given trader or active investor will wildly outperform his or her peers by only taking ‘trades’ in the direction of the primary or intermediate-term trend. In other words, don’t fight the trend until it ends.

By definition, in the trend following strategy, traders and investors simply stay the trend in the underlying market until it ends. It's a straightforward concept, however some key rules must be respected.

The trick to successful trend following lies in having a set of rules and technical tools that if and when triggered, give the trader the nod that his entry point, stop loss, or profit target has been hit. The second and more difficult part is training ones brain to actually take the trade when the signal has arrived, and leave second guessing, doubt, fear and greed checked at the door — each and every time. Consistency is the key to success here. The more consistent a trader is in sticking to his/her rules, the less taxing the trend following strategy is on the mind.

Here is my check list for trend following:

  • Golden Rule: Don’t chase, patience is rewarded!
  • Buy/Sell: Pullbacks to moving averages and/or trend lines or breakouts
  • Buy/Sell: Breakouts above moving averages and trend lines
  • Buying/selling after confirmation increases odds of success
  • Buying/selling at pullbacks greatly limits losses and maximises profitability
  • Use momentum oscillators for confirmation of support/resistance at moving averages and trend lines
  • Use candlesticks for confirmation of support/resistance zones
  • Use confluence zones — i.e. the coming together of multiple indicators, to add to trend following positions
  • It’s ok to get stopped out — that's the cost of doing business

A trend is broken or weakening when:

  • A major trend line or moving average snaps
  • Long candlesticks (engulfing, hammer, shooting star…) start to appear on the charts
  • Momentum oscillator begins to show divergence from price action
  • All of this might sound overly simplistic, but these are the broad rules that I have applied to successfully stay on the side of major trends over the years.

An actual trend following example

One stock that I have been riding higher on and off for over the years is Google (GOOGL). It has been a highly rewarding stock to trade from the long side. When a moving average or trend line breaks, then the following support zone below gets targeted. Back in October 2013 for example, when Google stock broke below its 50 and 100-day moving averages, the next support became the trend line, which ended up holding like a champ, making me go back to a long position in the stock. As the stock pushed back above the moving averages, I added.

Use Straightforward Technical Indicators

In order to best understand the swing trading/active investing strategies, let’s go through the technical analysis tools that I use, which I prefer to keep simple. The trick to using technical analysis correctly is to use them for reference areas rather than absolute points to place stops/targets. In other words, it’s more of an art than an exact science, and using common sense goes a long way.

Simple Resistance/Support Lines

A clear resistance or support line can be immensely valuable for swing trading, but I stress, if used the correct way.

I use such lines in two ways; 1) Leaning against them as resistance/support and 2) Breakouts

The key lies in understanding that resistance/support lines are not exact points but rather reference levels that need breathing room. In both charts below each time resistance was reached the stocks soon thereafter pulled back, thus respecting the resistance lines and for swing traders setting up juicy trades to the downside in this case. Ultimately both resistance lines were broken through to the upside with force, thus getting entirely disrespected/disregarded and for swing traders/active investors setting up trades to the long side.

Moving Averages

I use moving averages in much the same way that I use resistance/support and trend lines, with one big exception; moving averages work much better as reference points in trending markets. One could use exponential moving averages and all sorts of different methods, but since I am using them as big level reference points rather than blind buy/sell signals, I don’t see the need to quant-tweak them.

The below left chart shows Apple Inc (AAPL) in a longer-standing uptrend from 2009 through 2011. Note that each time the stock moved down to AROUND the red line (200 day simple moving average), it proceeded to bounce and eventually move to higher highs.

The chart on the right is of Netflix.com Inc (NFLX) and note how the 100 day simple moving average (blue line) held as support the entire way up, until it broke…which ushered in a big change of trend and ultimately a massive drop in the stock. Of course each stock has its own characteristics and acts different to the various moving averages. As such, when evaluating a trade based in part off the moving averages I always go back and check how the stock has reacted to the moving averages over the past three to six months to get a better feel. Technical analysis doesn’t have to be complicated; it just has to be used with the understanding that it is not an exact science and thus levels being referenced by the indicators need breathing room to work.

Keep the Right Mental Approach

Just like in sports for professional athletes, the right mental approach is critical for success in trading and active investing.

The following are the psychological rules I adhere to for trading and are taken from my favorite book on the topic: ‘Trading in the Zone,’ by Mark Douglas. (New York Institute of Finance, 2000)

‘Psychology plays a very important role in trading, and the development of a proper trader’s mindset should not be taken for granted. The unsuccessful trader has firm belief and expectations that are often not met by the market. When the outcome doesn’t match the expectation, the trader feels pain and often views the market in a threatening way. Once this occurs, traders are doomed to fail unless they can recognize what is wrong and develop the proper winning attitude of a successful trader.’

Adopt the following essentials for trading/active investing success:

  • Every moment is unique: The trade either works or it doesn’t
  • Anything can happen: Develop a resolute, unshakeable belief in uncertainty. The market has no responsibility to give us anything or do anything that would benefit us.
  • Markets are neutral: The market does not generate happy or painful information, therefore, no threat exists. Our expectations formed from our original beliefs are the sole source of any happiness or pain.
  • Losses are okay: Losing and being wrong are inevitable realities of trading since anything can happen. Taking small losses is part of a successful trader’s job.
  • Accept risk: Fully acknowledge the risks inherent in trading and accept complete responsibility for each trade (not the market). When a loss occurs, do not suffer emotional discomfort or fear. Think in probabilities.
  • Monitor emotions: Learn how to monitor and control the negative effects of euphoria and the potential for self-sabotage.
  • Abandon search for Holy Grail: Attitude produces better overall results than analysis or technique.
  • Rigid rules, flexible expectations: Adopt rigidity in your trading rules and flexibility in your expectations.’
  • Try: Yoga, meditation, breathing exercises, sports
  • Trading and investing does not have to be complicated. When you begin to implement the six points I discussed in this ebook you will be on the right path to success. After a while you will start to see the market with much more clarity and trade/invest with a level of confidence and assertiveness that you never thought possible.

A simple but repeatable method along with the right psychological approach is the key to successful trading and investing.

THE SPECIAL OFFER

The Ultimate Candlestick Bootcamp, plus the B2 Reversal Indicator and Scanner

The ultimate candlestick bootcamp (UCB) is an 11 part video-series trading course and 30 page e-book that will teach you Serge’s high probability trading and active investing strategies which he has learned and perfected over his nearly twenty years as a trader. These are some of the same powerful trading methods that professional traders such as banks, prop firms, and hedge funds use around the world in their daily trading activities.

The B2 Reversal Indicator is a powerful trading and investing indicator that works in any time frame and any asset class. High probability buy and sell signals represented by easy-to-read up and down arrows flash on the charts.

ABOUT THE AUTHOR

Author: Serge Berger, Head Trader and Investment Strategist
Company: The Steady Trader
Website: TheSteadyTrader.com
Services Offered: Trading Education, Trade Alerts, Trading Workshops
Markets Covered: Stocks, Options, Futures

Over the years, Serge has created a trading methodology that divides markets into different time-frames and characters, allowing him to more clearly and without emotions determine which strategies to apply in which situations.

Chapter
10

HOW TO "TREDGE" THE TRUMP RALLY

By Matt Buckley, TopGunOptions.com

War on the Korean Peninsula. No tax reform by year end. December debt ceiling fight and Fed rate hike. Black swan terror attack.

Moderate to strong earnings. Stock buybacks. Good jobs numbers and consumer confidence. Volatility at its lowest point since the VIX was introduced.

Confused on what to do in a market that can go either way in the blink of an eye? Don't be.

Matthew 'Whiz' Buckley, Founder & CEO of Top Gun Options, explains how a 'top secret options tactic' he teaches his members could see significant profits in the next month when, not IF volatility spikes. Whiz calls this tactic a 'Tredge' a trade designed to make money while also serving as a hedge to his front month and Jan19/20 long call diagonals.

Trading is combat. There's a winner and there's a loser and with this Tredge Whiz can put you on the winning side.

THE MOVIE - HOW TO "TREDGE" THE TRUMP RALLY


THE SPECIAL OFFER

Get Airborne with the Top Gun Options Intermediate Test Flight and get these high-flying benefits for the next 14-days:

  • Primary Live Trade Brief
  • Urgent Alerts  
  • Options Pocket Checklist
  • Primary Workbook
  • Intermediate Workbook

ABOUT THE AUTHOR

Author: Matthew “Whiz” Buckley, Founder
Company: Top Gun Options
Website: TopGunOptions.com
Services Offered: Trading Courses, Mentorship, Trade Alerts
Markets Covered: Stocks, Options

Whiz is a highly experienced financial business executive, and decorated Naval Aviator who graduated from Naval Fighter Weapons School (“TOPGUN”).

Chapter
11

THE IMPORTANCE OF DIVERSIFICATION

By Ayoub Ben Rejeb, ElliottWave-Forecast.com

“Don’t put all your eggs in one basket”

This is one of the most familiar and simplest quotes to explain diversification. The idea behind it is simple: If the basket falls, not all your eggs will be destroyed at once since they are spread out in different baskets.

While that belief certainly captures the essence of the issue, it provides little guidance on the implications of the role diversification plays in an investor's portfolio and offers no insight into how a diversified portfolio is actually created. In this chapter, we'll explain diversification and give you some insight into how you can make it work to your advantage.

What Is Diversification?

Diversification is a risk management technique that mixes a wide variety of investments within a portfolio. The theory behind this technique state that a portfolio constructed of various kinds of investments will, on average, yield higher returns and present a lower risk than any individual investment found within the portfolio because the positive performance of some investments neutralizes the negative performance of others. Therefore, the benefits of diversification hold only if the instruments in the portfolio are not perfectly correlated.

Money managers and investment professionals know the benefit of diversification which is why it's an essential component of any retirement savings plan. No one questions the logic of diversifying investments when it comes to a retirement plan. Everyone knows that diversification lowers risk, and if done right, the good investments will outweigh the bad ones.

Taking a closer look at the concept of diversification, the idea is to create a portfolio that includes multiple instruments to reduce risk. Consider, for example, an investment that consists of only one stock issued by a single company. If that company's stock suffers a serious downturn, your portfolio will take the full brunt of the decline. By splitting your investment between the stocks from two different companies, you can reduce the potential risk to your portfolio.

Why You Should Diversify

The goal of diversification is not necessarily to boost performance, it won’t ensure gains or guarantee against losses. But once you choose to target a level of risk based on your goals, time horizon, and tolerance for volatility, diversification may provide the potential to improve returns for that level of risk and it can help an investor manage risk and reduce the volatility of an asset's price movements. Remember though, that no matter how diversified your portfolio is, risk can never be eliminated completely.

You can reduce risk associated with world indexes or individual stocks but general market risks affect nearly every instrument as we believe that there is one market and everything is correlated in multiple degrees, so it is also important to diversify among different asset classes. The key is to find a medium between risk and return; this ensures that you achieve your financial goals while still getting a good night's rest.

Building a Diversified Portfolio

Modern portfolio Theorists and Trend Following Wizards, usually emphasize this concept and are often quoted as trading around 100 different types of instrument, if not more. But diversification isn't only based on having multiple instrument and can be done through other methods.

With so many investments to choose from, it may seem like diversification is an easy objective to achieve, but that sentiment is only partially true.

To start building a diversified portfolio, you need to make sure your asset mix is aligned to your investment time frame, financial needs, and comfort with volatility. Then you should look for assets (stocks, commodities, bonds, cash, or others) whose returns haven’t historically moved in the same direction, and to the same degree, and, ideally, assets whose returns typically move in opposite directions. This way, even if a portion of your portfolio is declining, the rest of your portfolio, hopefully, is growing. Thus, you can potentially offset some of the impact of a poorly performing asset class on your overall portfolio.

Another important aspect of building a well-diversified portfolio is that you try to stay diversified within each type of investment.

Taking the case of trading stocks, within an individual stock holdings, beware of over-assemblation in a single stock. For example, you may not want one stock to make up more than 2% of your portfolio. We also believe it’s smart to diversify across stocks by market capitalization (small, mid, and large caps), sectors, and geography. Again, not all caps, sectors, and regions have prospered at the same time, or to the same degree, so you may be able to reduce portfolio risk by spreading your assets across different parts of the stock market. You may want to consider a mix of styles, too, such as growth and value.

Inside every asset class, there are further categories that you can choose from. Take for example, Gold. You can buy physical gold or you can invest in Gold Schemes of Banks or you can also buy a Gold Fund that invests in gold mining companies or you can directly trade the spot of Gold "xau" against any currency and then of course you can buy an Exchange traded fund or a Gold ETF.

In equity, you can look at various sectors and the specific stocks within those sectors. A good example could be to invest in defensive sectors (those that do well even in an economic downturn) like consumer goods or healthcare and then going one step further, you would want to commit your money to the largest public-sector bank or the consumer goods company that has started showing a high growth in its sales.

Similarly, when it comes to your bond investments, consider varying maturities, credit qualities and durations, which measure sensitivity to interest-rate changes. Generally, the bond and equity markets move in opposite directions, so, if your portfolio is diversified across both areas, unpleasant movements in one will be offset by positive results in another that's why a combination of asset classes will reduce your portfolio's sensitivity to market swings.

Let's say you have a portfolio of only airline stocks. If it's publicly announced that airline pilots are going on an indefinite strike and that all flights are canceled, share prices of airline stocks will drop. Your portfolio will experience a noticeable drop in value. However, if you counter-balanced the airline industry stocks with a couple of railway stocks, only part of your portfolio would be affected. In fact, there is a good chance that the railway stock prices would climb, as passengers turn to trains as an alternative form of transportation.

But, you could also diversify even further because there are many risks that affect both rail and air because each is involved in transportation. An event that reduces any form of travel hurts both types of companies - statisticians would say that rail and air stocks have a strong correlation. Therefore, to achieve superior diversification, you would want to diversify across the board, not only different types of companies but also different types of industries. The more uncorrelated your stocks are, the better.

Further diversification benefits can be gained by investing in foreign securities because they tend to be less closely correlated with domestic investments. For example, an economic downturn in the U.S. economy may not affect Germany's economy in the same way; therefore, having German investments gives an investor a small cushion of protection against losses due to an American economic downturn.

Looking at another example of a stock portfolio, which includes Apple, Facebook, Amazon, Microsoft, Google (now Alphabet), Tesla and a bond for “safety”. If the holder has asked, “Am I diversified?” the answer would have been a resounding “No!” As many of you know, most of these companies are related to technology and the only play here is the hope for this sector to keep going up forever! One quick reversal and months of gains will be wiped out. Obviously, in a six-stock portfolio, having 5 of them directly related to internet industry is not diversified.

Diversification for Day Traders

Diversification in the world of investing is the synonym of “safe” or “secure”, yet despite of the advantages diversification brings to trading, it is a relatively foreign concept to day traders.

There are three types of diversification commonly used for day trading or swing trading. This is not a complex process, by diversification you are simply having multiple trades on the same time and for different reasons. We will use the Forex market for these examples, as it is a 24-hour market, and the margin requirements are not increased for holding positions overnight (as with futures and stocks which may make applying these methods more difficult).

Forex Pair Diversification

Instead of always just trading one pair we will look for trade setups in multiple pairs. Whether day trading or swing trading this often means having multiple positions going on at the same time. And there is an advantage to this. Let's assume that your average win ratio on your strategy is 60%, meaning for every 100 trades you will win 60 of them, on average. By just taking one trade, you do have a slight edge and you're expected to win that trade about 60% of the time, but with just one trade really anything can happen as you could easily lose on it.

But the more trades you take the more you'll see the 60% win-rate advantage. Think of a casino, they could easily lose 1 hand of a blackjack, but over the course of a week and thousands of hands they rarely lose. I'm not suggesting that you over-trade, which is when you just trade to trade, with no strategy in mind. I am talking about taking more opportunities using a well-defined strategy. This typically means looking at multiple Forex pairs for trading setups.

While some Forex pairs are highly correlated, most are not. You can take multiple positions in different Forex pairs and they are all doing to move slightly differently. Assuming you have a decent strategy with at least 1/2 as a risk / reward and if your strategy does win more than it loses, then if you take 10 positions, you may lose on 4 or 3, but you’ll make money on the other 6 or 7 positions. But even if you end up losing 6 positions and only winning 4 of them you will end up on the winning side as your reward was double your risk.

Let's take an example and see what happens when a trader is long the EURUSD, long the GBPUSD, short the USDJPY and short the USD/CHF?

What this trader has done is actually going short the US Dollar in every position! (If you are brand new to Forex trading, all of the trades are done in currency pairs. When you go long the EURUSD pair, you are basically buying the EURO currency while at the same time selling the US Dollar currency. If you go short the USDJPY pair, then you sell the US Dollar currency and buy the Japanese Yen currency.)

Using this type of diversification is only increasing your risk for the main traded currency (US Dollar) and it will result either in a bigger loss / gain, unless there is a specific event that makes one pair do a separated move like the case for USDCHF in 2015 when SNB (Swiss Central Bank) unpegged the franc causing a spike in CHF pairs.

Perhaps this trader could be short the EURUSD, short the EURNZD, long the AUDCAD and long the GBPJPY. This way, no more than two positions are taken on the same currency at one time and both positions are on the same side (long or short) of the individual currency.

Strategy Diversification

Since most pairs are going to move differently than one another, the price action in them will be different based on volatility and they will have different structures which means different trade set-ups.

Using the same strategy all the time is good. Yet having two or three strategies can help out with stabilizing your profits over time.

Over the years I have tested and developed many strategies, yet most of them have at least one weakness, which means in certain market conditions it will not perform as well as other strategies. By utilizing three strategies at the same time, the strengths of certain strategies help offset the weaknesses in others.

Let's assume you initiate three trades using the same strategy which does not do well in volatile conditions, and on this day an unexpected event rocks the markets so you lose on my three trades.

Now assume you had used three different strategies, the one above, one which does very well in volatility and other which fairs ok. Now instead of losing three trades you potentially make money on one or two.

So consequently, you should prepare yourself for different market conditions either by having more than one strategy or by adapting your main strategy to new changes. You don’t have to use multiple methods to be successful. Many day and swing traders make a living trading one strategy, in one Forex pair on one time frame. These methods are just alternatives to consider.

Timeframe Diversification

To be able to diversify using timeframe, you'll need to combine the strategy and Forex pair diversification and then adds the time element. Look for trade set-ups on different time frames, you may typically trade off a 5 minutes chart, but there are also trades based on a 15 minute, hourly and daily charts, etc. The bigger the time frame the better the set-up as it will have lesser oscillation which means lesser possibilities.

As discussed above, assuming you have a winning a strategy, all these trades help give you an edge each day. One day you may be having a losing day trading, but a couple of your swing trades come in resulting in a profit for the day. It may work out that the swing trades lose as well, resulting in a bad day, but the odds of winning are greater than they are for losing. Assuming a greater than 60% win-rate on your trades, any high quality that you add is likely to produce more winning days.

Modern Diversification

We at ElliottWave-Forecast.com are implementing a more advanced way of diversification because market conditions have changed during the recent years and we believe that forecasting is a process of continuous adjustments. We are living in the era of electronic trading where machines have taking over humans by automatically generating signals and executing trades. Consequently, we think that every trader needs to focus on the technical aspect of the market rather than trading based on fundamental news.

Combining different type of diversification is the best way to trade in the modern world, that's why we only use Elliott Wave Theory as a language to help us read the market but that is not enough as an analyst / trader needs to add tools to help him decide when the idea is right or wrong. So, based on this we build our own strategy to forecast the market using Elliott wave, market correlation, time cycles, sequence of swings using our own proprietary distribution and pivot system.

We like to concentrate on the right side of market following the main trend starting from the higher time frame chart and we only want to take high probability trades based on our solid system with high accuracy which will act as a great trading tool.

The main idea is to focus on the trending instrument which have the clearest structure providing a tradable bullish / bearish sequence. So according to that concept we've been calling the world indices higher since 2010 and only looking to buy the pullbacks using the corrective 3, 7 or 11 swing sequence.

Once you have established long-term trades then you can look to diversify your portfolio by taking other swing trades in stocks or commodities and you can use Forex to trade the shorter-term cycles.

There is a positive side effect to doing this. You will realize that you can’t predict which trades are going to win and which ones are going to lose or break-even. Therefore, you won’t get attached to any single trade because you'll start to see the market as simply numbers and not about being right or wrong. This type of understanding is crucial to trading longevity.

CONCLUSION:

Diversification is considered as one of the main keys to great performance by using different trading strategies and instruments in order to have a higher chance of survival. However, diversification must be done correctly because when it is not done adequately it can have an opposite effect and compound instead of diminish risk.

Regardless of your means or method, keep in mind that there is no general diversification model that will meet the needs of every investor. Your personal time horizon, risk tolerance, investment goals, financial means and level of investment experience will play a large role in dictating your investment mixture. Start by figuring out the mix of stocks, commodities and cash that will be required to meet your needs. From there, determine exactly which investments to use in completing the mix, substituting traditional instruments for alternatives as needed. If you are too overwhelmed by the choices or simply prefer to delegate, there are plenty of professional's financial services available to assist you.

THE SPECIAL OFFER

Stay ahead of the market and Improve your trading performance by getting access to our 52 instruments updated in 4 different time frames, 2 Live Market Sessions done by our Expert Analysts every day, and our Live Trading Room with daily setups and 24-hour chat room support.

ABOUT THE AUTHOR

Author: Ayoub Ben Rejeb, Technical Analyst
Company: Elliott Wave Forecast
Website: ElliottWave-Forecast.com
Services Offered: Trading Education, Forecasting, Videos
Markets Covered: Stock Indices, Futures, Forex (50+ Instruments)

Ayoub Ben Rejeb is a Technical Analyst at ElliottWave-forecast.com which provides professional grade Elliott wave forecasts for different markets including Forex, Commodities, Indexes and stocks. Ayoub holds a Bachelor's degree in Mathematics and he has been actively trading for the last 6 years.

Chapter
12

SURVIVING THE IMPENDING CRASH WITH THE 2ND WAVE TRADE

By Scott Morris, PivotScalper.com

Over the past 10 years we’ve been inundated with new reports of an impending market crash. The funny thing about recessions and market crashes is that those who have a strategy to Survive and Thrive during such economic events usually make out like bandits.

So, what’s your strategy?

If you don’t have one, you better get one, and fast. I’m not trying to scare you, I’m just reminding you that if you don’t want to be on the wrong side of the next economic meltdown, you need to wake up and get busy.

There are plenty of ways to protect yourself but I’ve always found that understanding some basic market forces always gives me an edge. When the market crashes, it only hurts investors who are sitting on stocks waiting them to go up in value. For those of us who are “traders” we don’t care if the market goes up or down, we just care that the market is moving, and in all economic climates, the market moves, it breaths, it goes up and down, and that is all we need to protect ourselves and make money.

In this article, I’m going to introduce you to a simple strategy that I use every day. It is based on a Price Pattern that repeats itself constantly no matter what the general economy is doing and it will continue to repeat itself during a market crash.

So, this is one of many strategies or plans that you could adopt to protect yourself from the coming market crash. Let’s face it, the market MUST crash sooner or later, and with Donald Trump taking over the reins of our economy I am expecting a massive correction to the downside simply to bring reality back to the markets that Obama overinflated.

All politics aside, no matter who would be President our economy and $20 Trillion in debt is not sustainable. Level heads must prevail and allow the market to come back down to find equilibrium.

And that is where my 2nd Wave Trade comes in and this is a plan that you can implement right now.

Elephant Footprints

A friend of mine and one of the smartest traders in the world uses a brilliant metaphor when describing what happens in the markets and on your charts when they are being manipulated.

He says: “When Elephants walk across your lawn Scott, they leave footprints

And when Elephants, or in the case of trading, the “Monied Elite” or the “Market Makers”, the “Market Manipulators”, or “The Big Money” walk across or enter the market, they leave their foot prints all over your chart in the form of Price Patterns.

The 2nd Wave is such a Price Pattern, and all we have to do is learn to recognize the pattern and we can enter that trade every time it exposes itself and take our piece of the action.

I talk to traders almost every day who tell me they have been trading for 5 years or 15 years or even 25 years and they just can’t figure it out; they just can’t seem to get a break and win. I know exactly why they don't win or can’t win. Its because they don’t stick to a single strategy long enough to master it and usually they chose the wrong strategy or training to begin with.

Let me illustrate what I’m talking about.

If what I’m about to tell you is true, then every single trader in the world should be buying and using my 2nd Wave Trade. And, I have no doubt they would if they gave it a couple of weeks without getting distracted by the next shiny object or headline that comes along promising riches without so much as a mouse click.

But let me show you the 2nd Wave Price Pattern and you can decide if it has merit. This trade you can find on any chart in any timeframe and on any day of the week and in any instrument you chose.

So let’s look at the highlighted box first:

  1. You can see where it established a “Bottom”. We don’t know it’s a bottom when if first forms, we only know it’s a bottom after the price moves up, pivots again, and does not move down to the level of the previous bottom pivot.
  2. When the price moves up from the bottom we see a DoubleTail signified by the Yellow Doji and this is the beginning of our 2nd Wave Trade.
  3. The price now has to move at least 2 candlesticks in the opposite direction and form another DoubleTail before we know we have a second wave.
  4. Finally once the DoubleTail has formed we wait for a blue confirmation candle to form and we can enter the trade long.
  5. The conclusion of the trade happens upon the formation of the next DoubleTail.

The Second 2nd Wave Trade

Almost immediately after the conclusion of this trade, a top is formed and signifies the beginning of another 2nd Wave trade.

In this case the price action comes way down before it pivots to give us our second 2nd Wave trade on this chart good for over 40 ticks in the NQ.

Now let me show you several more charts where the exact same price pattern repeats itself and see if you can recognize the 2nd Wave.

Can you see the top in the chart below?

Can you see how the price action moves down, then pivots, then pivots again to begin the 2nd Wave Down?

Learn to recognize this Price Pattern and you will never work again in your life.

Now, let’s dissect the 2nd Wave Trade in minute detail:

Does this seem a little elementary to you? If so I can tell you that this could be another reason why you are not a winning trader. You can change all that by changing the way you think about trading and by who you follow.

Trading does not have to be difficult, and it is not difficult, but it is made difficult by many so called teachers and guru’s because by keeping it difficult it keeps them in business selling you expensive trading courses.

Well, I’m here to obliterate all that by showing you a simple Price Pattern that you can test on your chart without spending a penny. If you decide you could use my training or my DoubleTail to make recognizing these patterns easier, then I welcome your business, but you can do this all by yourself without anybodies help after you finish reading this report.

So let’s move on to my forensic dissection of a 2nd Wave Trade in images:

Image 1 shows the TOP, the Retracement, and the beginning of the 2nd Wave:

Image 2 shows the continuation of the 2nd Wave:

Image 3 shows the 2nd Wave continuing into profit and also shows that there is nothing for the trader to do until the next DoubleTail prints.

Now here is something that is worth the price of admission.

Every Reversal of priced happens on a DoubleTail, but not every DoubleTail signals a Reversal of price. So as long as you have red candles you have nothing to do but sit tight and let the trade execute:

Image 4 shows the conclusion of the 2nd Wave Trade signaled by the DoubleTail pivot at the very bottom:

The premise for this article is to convince novice traders that trading can be simple if you just allow it to be.

So many misconceptions are created by people who pretend to know something about a subject they actually know very little about or by people who believe something is complicated simply because they are unfamiliar with the subject.

We trade to make money, and the fastest way to learn how to make money trading is to MASTER a simple system like the 2nd Wave Trade and once you’ve mastered it never do any other trade as long as you live.

The 2nd Wave Trade will deliver to you as much money as you need to live any way and anywhere you want so why complicate your life trying to learn all sorts of other trading strategies that require months or years of learning?

Why?

It never made any sense to me.

Go back over my chart and my simple explanations of each one. Look on your chart every day and identify 2nd Wave trades and you will soon realize how simple it really is.

Compare the 2nd Wave Trade to any other trading system you’ve ever seen and see if it’s not the easiest to learn, the quickest to Master, and the surest way to make money trading.

Like I said, it works in any instrument, on any chart. The only thing I’ve done is create custom candlesticks to make the price patterns easier to recognize, that’s my claim to fame, but all I’ve done is enhance what is already there for all the world to see.

I encourage you to reevaluate your trading plan and your trading future. Take a serious look at what you are doing now and what you want to achieve with your trading.

If your trading goals are simple like mine, which is to make money every day in about an hour a day, then I hope you will Master the 2nd Wave Trade and toss everything else in the trash. Toss every other indicator you have in the trash because all they are doing is cluttering up your chart and distracting you from the Elephant Footprints that are there for anyone to see.

THE SPECIAL OFFER

If you’d like to know more about my 2nd Wave Trade you can visit http://PivotScalper.com or you can email me at [email protected] if you have questions.

I sure hope you got some value from the time you spent reading this short article. Everything you need to be successful making money trading is right here, so take the time to read it again and really give some serious thought to how you got where you now are in your trading and how you can get from where you are to where you want to be.

ABOUT THE AUTHOR

Author: Scott Morris, Founder
Company: Pivot Scalper
Website: PivotScalper.com
Services Offered: Trading Software Indicators
Markets Covered: Stock Indices, Futures (especially Crude Oil)

Through his website, Scott Morris set out to develop ultra simple trading methods that anyone can follow giving the regular guy and girl the opportunity to add significantly to their income while keeping their risk low.

Chapter
13

WANT CONSISTENCY IN YOUR TRADING? AVOID THE SINGLE BIGGEST MISTAKE MOST TRADERS MAKE…

By Justin Weinraub, DayTradeTheMarkets.com

The theme of this e-book is gaining consistency in your trading. That makes a lot sense of course. After all, if you’re a day trader, what could be better than adding to your account day after day?

And, I’m assuming, if you’re reading this, you’re pretty serious about your trading. In fact, if I had to make a bet, I’d guess you feel about “this close” to being consistently successful. I’ll bet you have some good days…then give it all back in a day or two. I’ll bet you have some setups that work nicely…until all of a sudden, they don’t.

I’ll bet there are day you feel like you have it all figured out and you’re on the way to massive success…and then there are day when you feel like you’ll never have another winning trade as long as you live. Right?

Here’s the problem: There is one over-riding mistake that almost every trader makes. You’re more than likely making it too. I include myself in this. I’ve been trading since the turn of the century. For the first 7-8 years, I was very consistent…a consistent LOSER that is! I blew out more than 5 accounts in that time.

It wasn’t until my mentor taught me a new and better way of looking at the markets and a new and better way of looking at the nature of trading that I finally turned things around. And, since learning this lesson, I realized that just about every trader makes this same mistake…unless they’re lucky enough to learn the solution in time.

In this report, I will:

  • Explain this mistake
  • Explain why it causes inconsistency
  • Offer an alternative perspective
  • Tell you about my personal solution to this problem

What Is This “#1 Mistake” Most Traders Make?

Quite simply, it’s having a “setup first” mentality. What do I mean by a “setup first” mentality? I mean that you are most likely focused first and foremost on your trade entry setup. You’re probably seeking out a set of rules that you follow to determine where and when you get into a trade.

In other words, if rule X and rule Y and rule Z are in place…you’re going to be “disciplined” and you’re going place your entry. Right?

Now, let me clarify something very important. There is NOTHING wrong with trade setups. I use several rule-based trade setups myself. I teach numerous trade setups myself. So, again, there is nothing wrong with trade setups…in fact…they’re a great tool.

Here’s the problem: IF your trade setup is the MOST IMPORTANT factor in your decision making, you’re in big trouble.

Why Doesn’t A “Setup First” Approach Work?

Very simply, different conditions REQUIRE different strategies. Look at the image below. It’s immediately and intuitively clear that you could drive fast on a dry, flat road and stay safe. However, if you try that style on a winding, icy, mountain road, you’re probably not going to have a very happy ending.

It’s true when driving. It’s true when trading. A trade setup that works in one market condition will get killed in another market condition.

In other words, if your first focus is following the rules of your trade setup, it will work great if the market conditions HAPPEN to be in alignment with the type of trade you’re taking. However, if your trade setups HAPPENS to NOT be in alignment with the type of trade you’re taking…you’re going to get killed.

Let me put it another way. Let’s say you have a “go with” or “trend” or “momentum” or “breakout” type of trade setup. If the market is breaking out (or what I refer to as being in the VERTICAL condition), you’re going to do great and make a ton of money. However, if the market is consolidating/choppy (or what I refer to as being in the HORIZONTAL condition), your trend/momentum trade is going to get killed. You’ll have a ton of false breaks and dead-end trades.

Conversely, let’s say you have more of a “fade” or “reversal” or “counter-trend” type of trade setup. When the market is consolidating (horizontal condition) you’re going to make consistent money. However, when the market starts to break from consolidation and starts to trend, your fade/reversal trade is going to take a beating.

Again…just to be crystal clear…there is nothing wrong with trade setups. Setups are great. The PROBLEM is when you do not understand the market’s condition FIRST.

In other words…

I realize the distinction between a “context-first-focus” vs. a “trade-setup-first-focus” is subtle. But, don’t underestimate its importance.

I consider this “shift” to be the single biggest factor in turning my trading around.

No longer was I stuck on the frustrating “hamster wheel” of:
– going on a quest for a great trade entry setup
– back testing it, sim testing it, etc.
– putting it to use in the live market…where it inevitably didn’t work as well as I’d hoped
– going back to the drawing board again and again

Nor, was I stuck in the “trap” of:
– finding a setup that actually worked!
– but, finding that it only worked “some” of the time
– knowing that if only I could eliminate my “clunkers” I’d be set…but not knowing how to do so

Once I realized that my number one job as a trader was to make sense of the market’s story FIRST…and then simply figure out which trade setup to employ based on the market context…everything turned around.

The Good News?

High probability, low-risk trade setups exist. However, if you take them blindly, whenever they appear, finding success will be difficult. The key, as explained above, is market CONTEXT first, THEN trade setup second.
The good news? Learning to read market context is a SKILL. And any skill is learn-able.
The great news? Once you learn this skill, it will pay off for the rest of your career.

What Is The Solution? How Do You Learn The Skill Of Putting The Market In Context, Day After Day?

Well, more good news…this is exactly what I focus on day after day in my trading, and it’s exactly what I teach to other like-minded traders.

First, you use a tool called “relative aggression bars” to make sense of the strength/weakness of buyers vs. sellers.

Then, you use these aggression bars as the foundation for what is called “box logic”.  

Boxes break the market into smaller pieces.  Rather than having to make sense of everything happening, you learn to make sense of the market’s behavior within THIS current box.  Plus, you learn to make sense of how each individual box relates to the others.  These boxes give you an amazing STORY of what’s going on in the market each and every day.

I hear it every day from clients…by using boxes, they’re seeing the market more clearly than they ever have in their entire trading career.

Then, you use what I call the “2 out of 3” method.

Go Beyond Luck.  Have a Repeatable Process
Here’s where it gets interesting.  The aggression bars and boxes are great indicators…they really are! But, they’re just ONE PIECE of the puzzle. Like I’ve been saying throughout this article, you can’t get locked in to your setups and indicators in a vacuum. You have to put everything into CONTEXT.

What I use to put the market into context, and the way I teach it, is with what I call the “2 out of 3” method. 

Evidence Point 1:  Boxes. 
They develop throughout the day and give you the short term “lay of the land” each day.

Evidence Point 2:  Zones. 
These are intermediate term areas of expected support/resistance.  We know these heading into the day. How the market reacts at these levels gives us a strong clue.

Evidence Point 3:  Big Picture Bias. 
This is the longer-term path of least resistance. 

Do all 3 of the 3 evidence points line up? If so, you have a very strong edge.

Do 2 of the 3 evidence points line up? You have a strong edge.

Do 1 of the 3 evidence points line up? You better be careful and either stand aside or trade with reduced risk.

Do 0 of the 3 evidence points line up? You need to stand aside and wait for better evidence later. 

In other words, you identify a trade setup. But, rather than taking it blindly, you have the ability to make sense of the QUALITY OF THE OPPORTUNITY vs. the RISK NEEDED.

If you consistently put yourself in situations where the risk you need to take is reasonable compared to the quality of the opportunity, you very simply WILL succeed. That’s the game we’re playing. That’s how it works.

VIDEO EXAMPLE: THE “2 out of 3” METHOD FOR REPEATABLE TRADE DECISION MAKING

This video is from a few weeks ago and it’s from the Gold market. Don’t worry if you don’t trade Gold. This process is the same for any market. The important part is that it gives a step-by-step explanation of this “2 out of 3” decision making process.


THE SPECIAL OFFER

If you’re the type of person who has read through this article, watched the video, and like the concepts I discussed…then you’re the exact type of person who I love to work with.  And, for that reason, I’d be happy to give you a special offer.  Simply email me at [email protected] and let me know your read this article.  I’ll reply back with a highly discounted offer. 

ABOUT THE AUTHOR

Author: Justin Weinraub, Co-Founder
Company: Day Trade the Markets
Website: DayTradeTheMarkets.com
Services Offered: Trading Education, Software, Daily Market Assistant
Markets Covered: Futures, Day Trading

In addition to his personal trading, Justin provides access to his proprietary “relative aggression bar’ software, teaching his “box theory” and “trade quality scoring” methodology, runs a live education room, and creates a “daily market assistant” each day.

Chapter
14

SWING FOR THE FENCES? FIRST, CONSIDER TRADING FLOW

By Jon Johnson, InvestmentHouse.com

Over the many years we have been trading, teaching, and coaching traders we have observed that many, at least initially, have what we consider to be an unrealistic expectation of how successful trading flows. They seem to expect each trade to realize great gains and are disappointed if the gain is not great or if a loss is suffered. At times that disappointment results in the trader withdrawing from the activity because he doesn't think it can work for him or because he didn't make money fast enough. One of the problems may be that he has yet to understand the flow of trading.

What we have found is that a whole lot of trades are of the "kiss your sister" variety where gains are not particularly exciting and there are quite a few trades that result in losses. Occasionally, however, a specific trade takes off and does exceptionally well. Provided a trader cuts losses appropriately on the losing trades, the less exciting gainers can be the meat and potatoes while the occasional big gainer can make the difference between mediocrity and excellence. When a trader understands that there will be losses and there will be more trades that just make a little than there are trades that make huge gains, he can adjust his thinking. The fact is that we can never know ahead of time which trade will be the superstar and which will be the small gainer or the loser. We can only know that if we are really to become traders we will experience some of each. If we are really lucky, the big gainer will come first and often, but it may come later and less often. We just can't know ahead of time.

As far as we are concerned, trading is a business and we are in it for the long haul. That means we ride the flow, working to keep losses small, capturing the gains in a fashion that avoids cutting profits as much as possible and accepting that only some of the trades will achieve great results. Those, we believe, are more realistic expectations and enable me to achieve what we consider to be acceptable results.

Impatience and unrealistic expectations are rampant in many retail traders. If they don't get a fantastic return on the first swing, they allow doubt to affect their trading actions and may immediately switch methods or stop their learning efforts or stop trading. The fact is that first trade is only that; a step along a much longer path. Experience on that path teaches more and more about flow as it is gained.

Ted Williams, perhaps the greatest hitter of all time, had a lot of natural power, but he doesn't hold the home run record. He picked his pitches and knew that some pitch locations simply weren't conducive to the long ball, but could be hit successfully to the opposite field for singles or doubles. In trading, we have found that there is nothing wrong with singles and doubles and if we are persistent and work to pick the right "pitches to hit" the home runs come at times as well.

Now, Let's Look at Breakouts

If a stock breaks out of a well-formed pattern on 1.5 times the 50 day average volume or better, it has a good chance of continuing the move up. How much each stock gains is dependent upon that stock. Stocks breaking out of a cup with handle usually race ahead, and then succumb to some profit taking as short term investors get out and analysts say the stock is overvalued. That is why we usually don't panic if a great stock breaks out and we don't catch it on the first move. We want to catch that move, but stocks often test the breakout to some extent before it moves back up.

There is no real limit to how far a stock can run on a breakout from a cup with handle pattern. If a stock moves 20% in the first few weeks out of such a pattern, it is worth holding the stock and letting it run for you. Stocks that move that well on a breakout are usually the big winners in a rally. If you are playing options, you may want to enter and exit a position as a stock breaks out and then starts to succumb to profit taking - you can wait with a stock, but an option is a wasting asset. When a stock breaks out of a strong pattern, we tend to let it run. 

Volume, A Closer Look

Above, we stated that we look at 1.5 times the 50 day average volume. When we refer to this in our trades itt is the volume for the entire session. We are looking for the volume to be in that neighborhood when the day is done. Of course, that means we will many times be taking positions without really knowing what the final volume for the day will be when we see an early breakout over resistance levels. At that time we look what volume is; we already know what we want it to be for the day and we can make a comparison. If we are not comfortable, we can wait a bit and see if volume is jumping. We are looking to extrapolate where it is this session in relation to the 50 day MVA. We like it best when volume is strong and the stock breaks out later in the session; that is a clear buy.

In summary, when a stock breaks through the buy point, we usually look for a surge in volume. We then make the play. We also put in buy stop orders a quarter point above the breakout when we are not going to be around based on the idea that if it breaks that level it will most likely be on strong volume. If we are wrong we simply have to use stop losses to protect us. It is reality that we cannot watch the market all day every day; we do not want to. We pick our buy points carefully as we want to be able to buy with confidence whether we can watch closely at the time or not.

Ascending Wedge Patterns

Ascending wedges can lead to some explosive breakouts, and this is especially true when the market is making bullish moves. They can form over a short period (couple of weeks) or over months. Clearly, it is a more bullish pattern in an overall stronger market or strong run by a stock - we often see them form after a stock has broken from another pattern, like a cup with handle, and the pattern holds above the breakout point on the test. It forms the ascending wedge on top of the former pattern, and leads to a big move. Of course, it does not have to form in that manner. We have had dozens break out over the past year. A descending wedge works in the opposite direction. The stock makes lower highs while holding a steady low, and pressure builds for the downside break.

We can look at wedges and certainly get an idea of the strength of it by looking at the various factors that affect the overall pattern. For example, in the best ascending wedges you will see volume build on the moves up but ease off as the stock falls back. We look for a volume surge as the stock moves over the highs of the pattern. The results can be explosive, but if we are not in a strong up-trending market the breakout can be short-lived, but the few sessions of moves can be quite lucrative. 

How and When to Take Action on Your Breakout - The Pivot Point

When we refer to a breakout, we are talking about a stock price exceeding a certain level within a chart pattern. The pivot point is another term for the breakout point. That is the point we want to buy.

When a stock forms a technical pattern such as a cup, it "breaks out" of the pattern when it exceeds the prior high. The "pivot point" is the buy point, and it is $0.10 above the former high. The reason the pivot is $0.10 higher is because the former high serves as resistance, and we need to see that the stock price clears that former level before we buy into it. Now, we prefer cups that form handles before they breakout. That is when, before it reaches the former high before it started its correction, it pulls gradually back in a flat, slightly declining consolidation on low volume. This action 'shakes out' weak holders who bought near the former pattern high and are just looking to get out as close to even as they can. They see it approach the old high, fail to take it out, and then start to fade again. They want out. When a pattern forms a handle, the pivot point is $0.10 above the high in the handle (the intraday high, not the closing high). (With ascending wedges, we also use the pivot point being $0.10 above the former high in the pattern.)

Volume is a key factor in breakouts. In a breakout from a cup with handle, we look for volume of 1.5 times the daily average. For an ascending wedge, as a rule of thumb we can make the play with volume of 1.35 times the average volume. 

ABOUT THE AUTHOR

Author: Jon Johnson, Chief Market Strategist
Company: Investment House
Website: InvestmentHouse.com
Services Offered: Trading Newsletters, Trading Education, Alert Services
Markets Covered: Stocks, Options

In 1998, InvestmentHouse.com teamed up with Chief Market Strategist Jon Johnson. Subsequently, InvestmentHouse.com began publishing the Stock Split Report, Technical Trader Report, The Daily and the IH Alert service.

Chapter
15

Using Order Flow to Trade Reversals and Breakouts

By Peter Davies, JigsawTrading.com

In this video, we take a look at a reversal trade and a breakout trade. Not only that but the 2 setups are triggered at the same price - just at different times of the day.

This is a dilemma for many traders when the market returns to a high/low, will it be a double top/bottom, or will the market break out and make new highs/lows? There's a trade on either way – but which will it be this time round?

Reversal trades and breakout trades may be initiated from the same location but they are very different in terms of the way the trades set up. For a reversal trade, you can take advantage of the reversal without having to get in at the very point it reverses. There is a lot of manipulation at reversal areas, so it is often best to let the market reverse first and then get in when you have confirmed the reversal. It will cost you a few ticks on the entry price, but you will be right a lot more often. In the video, we take a look at how to use high volume nodes to determine at which point the market has officially reversed. We also look at how to use order flow to time the entry.

Breakout trades on the other hand, are much faster. You are trading into the stops of people that think (in this case), the low will hold. The moment the low breaks, there is a good chance the market will break down hard. You can't really let the market break before getting in, you have to get in before it breaks – but how will you know that's about to happen? The signal from the order flow in this case is an increase in order momentum as you get to the level. It's not hard to spot, but you do have to be brutal with your trade management and exit if the momentum fades.

In the video, we first go over the theory of using high volume nodes to play reversals, and we then look to see how it plays out in real time.

THE MOVIE -  ORDER FLOW: HIGH VOLUME AND MOMENTUM


THE SPECIAL OFFER

As you can see, order flow gives you a definite edge in terms of timing your entries. For many traders, it's the difference between being profitable and being frustrated. Still, order flow is not for everyone. If you'd like to know if it's for you, then for the next 7 days, we are offering a free 20-minute consultation where we will look at:

  • What you've done in trading so far.
  • What worked & what didn't.
  • What your goals are.
  • How much work you are prepared to put in to make trading work.

If you are looking for an "easy way to trade", then we probably can't help you because taking money off other traders requires you to put in some work. We meet traders that have been looking for an easy way to trade for 5,10 even 20 years. We know proprietary firm traders that were profitable trading firm money after 6 months, so we stick with what the proprietary firms teach and the methods they trade. Sure – it's not as easy as looking for one line crossing over another but then these techniques have the benefit of actually working.

For your free consultancy, go to our website, click the chat icon at the bottom right of the screen, enter your contact details and time zone and that you'd like to take advantage of the free consultancy session. We'll then get in touch with a time and place. Take action now if you want to see huge improvements in your trading over the coming months.

ABOUT THE AUTHOR

Author: Peter Davies, Founder
Company: Jigsaw Trading
Website: JigsawTrading.com
Services Offered: Trading Software, Trading Education, Trading Community
Markets Covered: Futures, Day Trading

Jigsaw Trading was created when Peter Davies created a set of tools to organize Order Flow information in what he thought was a more logical manner.​

Chapter
16

A LOSE SMALL, WIN BIG SYSTEM FOR LOW VOLATILITY ENVIRONMENTS

By Trent Smalley, DTN.com

Recognizing Your Environment

An essential practice before planning any trade is to make certain we understand the type of market environment we are in. Are we in a market characterized by speed and highly correlated moves? Or are we in a low volatility environment where indexes may be range bound but the movement under the surface in individual stocks is aplenty? Most recently it has been the latter as shown by the CBOE Volatility Index (VIX):

The primary trend of the VIX continues to be a downtrend with readings in the teens and below being prevalent. Prolonged periods of low volatility (VIX readings in the teens and lower) set up well for picking individual stocks. Then, once we have a group of individual stock setups, we can increase our leverage through option buying if we so choose.

Looking for Stocks Primed to Outperform

There are a number of ways one can scour the market for stocks poised to outperform. One of my preferred methods is to use a relatively unknown type of chart called a Relative Rotation Graph, or RRG©. RRGs are a powerful tool that allows us to gain an understanding of sectors exhibiting relative strength as compared to some benchmark.

Briefly, you can see that the RRG is separated into 4 quadrants: Leading (top right), Weakening (bottom right), Lagging (bottom left), and Improving (top left). For illustrative purposes, I have added a basket of ETFs to our RRG and set the comparison Index to the SPX. Any ETF in the top right quadrant is currently outperforming the SPX and gaining momentum, pulling further ahead. Those in the bottom right are outperforming the SPX but losing momentum. The bottom left quadrant contains names that are lagging the index and falling further behind, while those in the top left quadrant are lagging the index but gaining momentum, starting to catch up once again. To find long positions, we want to look at those in the top right quadrant, or those which are in the top left, moving into the top right. The XLE is just about to move from the top left to the top right quadrants, so let’s take a deeper look into the energy sector.

Individual Setups within Outperfroming Sectors

Once we have a bird’s eye view of sectors exhibiting possible outperformance, we want to scan through that group for individual stocks we think have the potential to outperform the ETF. Would it be easier to just buy the XLE ETF in this case? Perhaps. However, I’ve always felt that it was worthwhile to develop an eye for individual names with a good chance to outperform an index or ETF. Especially in an environment where we have low correlations among individual stocks.

How you choose to scan stocks in an individual sector is a matter of personal preference. There is no right or wrong way to do this, but I believe there is a best way: Look at them all. While that seems like a lot of work, it isn’t that bad. And, it can result in finding hidden gems.

My preferred way to do this is through the free site Finviz.com. There you can build a stock screen to scan the market based on the criterion you are interested in. In our case we want to look through the energy group, what Finviz calls “Independent Oil and Gas.” So we adjust the “Industry” to this. For this screen I am also going to adjust two other criterion: Option/Short to “Optionable” and “Average Volume” to Over 500k. This ensures we can trade options if we choose and that the stocks are fairly heavily traded.

Now we have our sector and our predefined screening criterion to ensure liquidity. Now, it is up to our eyes as market technicians to find individual setups. Within the screen we have just built we can quickly and easily have Finviz throw all of these names into thumbnail charts for us. You can do so by clicking “Charts” right under the “Relative Volume” selection. Click that and you will see a list similar to the following:

Our original scan on the date built delivered 57 names, so you will see 57 thumbnail charts. Of course you should feel free to adjust and play around with the scanning criterion.

Stocks that have “that look”

There are a number of different trading styles that are common. You will see breakout traders, momentum traders, and others. Over years of trading every pattern and style out there (and failing with most) I found one in particular which has consistently put the odds in my favor.

I want to buy stocks which have pulled back but are in longer term uptrends, that are supported by high volume nodes as shown by their Volume Profile.  

That was a mouthful. I’ll work on an acronym for next time. The best way to explain is likely through some examples:

In the chart above of Kosmos Energy we can see that KOS has been in an overall uptrend since the start of 2016 in our daily chart. It has gone through price discovery and is currently beginning to consolidate back near a high volume node, which acts as a support level. A pull back to the trendline drawn would nearly coincide with the area of the highest volume by price on the chart. Auction theory calls this the Volume Point of Control or “VPOC”. It is the price at which most shares have traded hands in the chart in question. These levels of high volume act as support and resistance. Price moves slowly through levels of high volume, and quickly through areas of low volume here. I am becoming interested in KOS and in a perfect world would be able to begin a position on a pull back just under $7.00 per share.

If I am trading stock I want to be long shares at or just below $7.00. Or, if I want to add some leverage and define my risk while deploying less capital, I will look to the options market. If the implied volatility is low, I often purchase premium and make a straight directional bet. I generally trade front month options at or near the money in these types of low volatility environments. You are free to get as fancy as you want to with spreads. I’ll keep it simple with calls if they are priced right. I risk the premium and leave stops out of the equation.

Let’s take a look at another stock…

In the above chart of MRO you can see that the stock was in a pronounced price discovery mode beginning in early July, until it began consolidating in late August. I have a price alert set to notify me should MRO trade back into the HVN at about $13.70. We know from the previous example that these HVNs or High-Volume Nodes act as support and resistance. In this particular case, I’d like to see a bit more of a pullback to get in at a better price. Just under $14 would be ideal.

Before we wrap things up, I want to take one more example to drive home a point that is of the utmost importance in trading this strategy. Take a look at the following chart as an example:

Valero VLO is one of my favorite energy companies. Over the years I have traded VLO stock with much success. I am familiar with this name and am eager to trade it due to having fond memories of gains in it previously. Would it be wise for me to buy it here?

Absolutely not. But why? It’s in an uptrend recently just as the previous examples had been. It looks as if it is going to not only continue, but maybe even pick up speed to the upside. In a very short period of time this stock has gone from $64 to over $78. Buying it here would get us into a stock that has ripped higher. What’s not to love about that? Other than the fact it WILL pullback. You see, over time I have conditioned myself to never, ever buy stocks up. I wait for pullbacks always. If for some reason it continues on without a pullback (unlikely) that is just fine. I missed it and will look for others. But I will not buy it here.

Where do you think would be a good price to pull the trigger if we get a pullback? That’s right. Back at trend support which coincides with our volume profile HVN. (Green rectangle)

Again as a quick reminder, here is how we put it altogether in a simple, concise manner:

I want to buy stocks which have pulled back but are in longer term uptrends, that are supported by high volume nodes as shown by their Volume Profile. 

VLO isn’t a good buy at the current level because both conditions above aren’t satisfied. It hasn’t pulled back. However, if it does consider me interested.

THE SPECIAL OFFER

While this is a fairly easy trading technique to grasp, you do have to have two things to make it work:

  1. A charting application that has Volume Profile as a study.
  2. Clean and accurate market data to build the volume profiles correctly.

The combination I am using in this lesson is that of Optuma Trading Software combined with IQFeed Market Data from DTN. Optuma and IQFeed are two top of the line tools which are relied upon by professional traders. In fact, this combination is used by many in the CMT Association’s Chartered Market Technician Program. I began using Optuma as a new student when in the CMT Program and haven’t looked back. I know the founder and CEO well and he invites anyone I send him personally to a trial run of the program. I myself work for DTN and have arranged and special offer for market data to anyone who clicks the link below.

ABOUT THE AUTHOR

Author: Trent J. Smalley, CMT
Company: DTN, OmahaCharts.com
Website: DTN.com/trading, Omahacharts.com (Owner, head blogger and trader)
Services Offered: Market Data Solutions to top industry trading platforms, risk management software, market data for websites, mobile applications
Markets Covered: Stocks, Futures, Forex, Options and now Cryptocurrencies

Trent J. Smalley, CMT is a stock, options and futures trader based in Omaha, Nebraska. He has been employed in the Financial Technology industry for over a decade and is a member of the Market Technicians Association.