Any time you use technical analysis, confirmation is essential.
If you’re not willing to confirm, you’re doing yourself a great disservice. In fact, at no time will I ever just use Bollinger Bands (2,20), MACD, relative strength, or Williams’ R% alone.
That’s an amateur, foolish move.
If Williams’ %R is telling me something, yet four other indicators are not, I have to wait until all confirm the signals I need to proceed. And even if they all do agree, I want to confirm even more, which I can do with the Chaikin Oscillator.
The Chaikin Oscillator (CO)
Developed by Marc Chaikin, the Oscillator measures the momentum of the Accumulation Distribution Line (A/D) using MACD.
So, it’s an indicator of an indicator.
It’s also the difference between the 3-day EMA of the A/D Line, and the 10-day EMA of the Accumulation Distribution Line.
The purpose of this indicator is to identify momentum amid the accumulation/distribution line of the MACD indicator. What we’re looking at is MACD applied to the A/D line instead of price.
For example, if I want to figure out if a stock is going to move higher or lower, I can use MACD.
But if I want to drill down a bit more, I can use the Chaikin Oscillator to find positive or negative divergence from the zero-baseline, or what’s also referred to as the A/D line.
A cross below the A/D line tells me that traders are selling.
A cross above the A/D line tells me that traders are accumulating the asset.
What we’re simply doing with it is confirming our other technical pivot points.
The Most Efficient Way to Find Options Trades
Those who trade options on a whim, with no rules and no plan, will become food for Wall Street, often blowing out their accounts within months. On the other hand, successful traders spend months, and sometimes years, mastering a few strategies before risking a dime in the markets.
Tap here to see a demo of a proven options strategy that leverages decades of data and statistics.
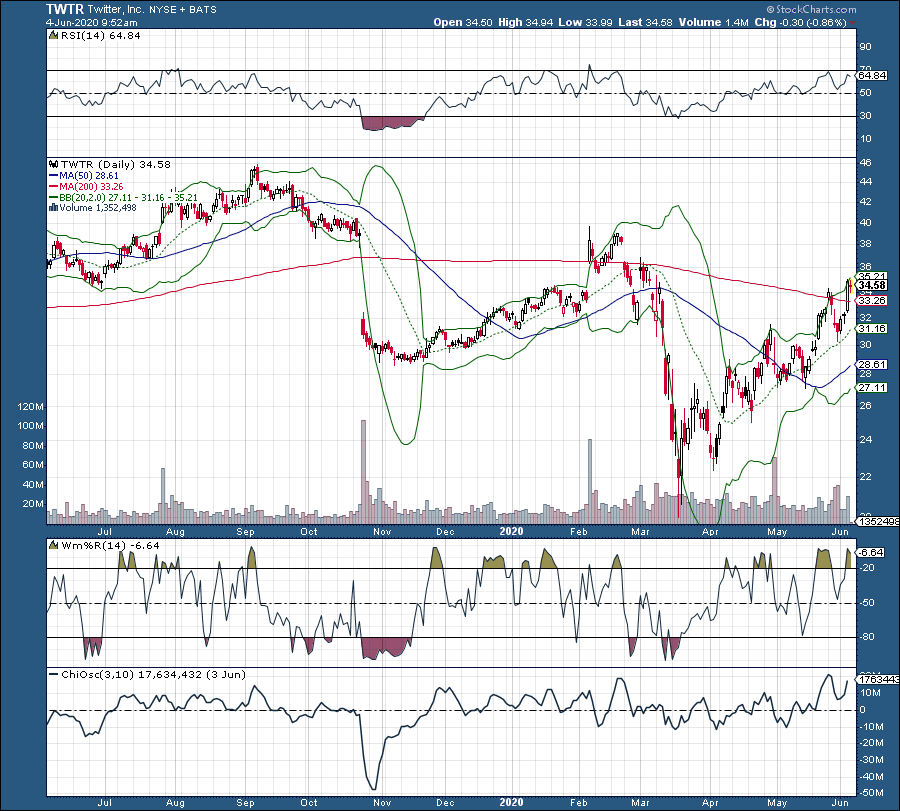
Let’s look at its application with Twitter (TWTR).

On a one-year chart, look at what happens when the stock hits or penetrates the upper or lower Bollinger Band (2,20). It begins to pivot, especially when confirmed with RSI and Williams.
Now, look at what happens each time CO dips below its zero-line as RSI and Williams fall into oversold territory. The stock begins to pivot higher.
Or, look at what happens when CO jumps above that zero-line with confirmation of overbought signals on RSI and Williams. Now, the stock begins to appear stretched, and eventually falls.
